Security Hub
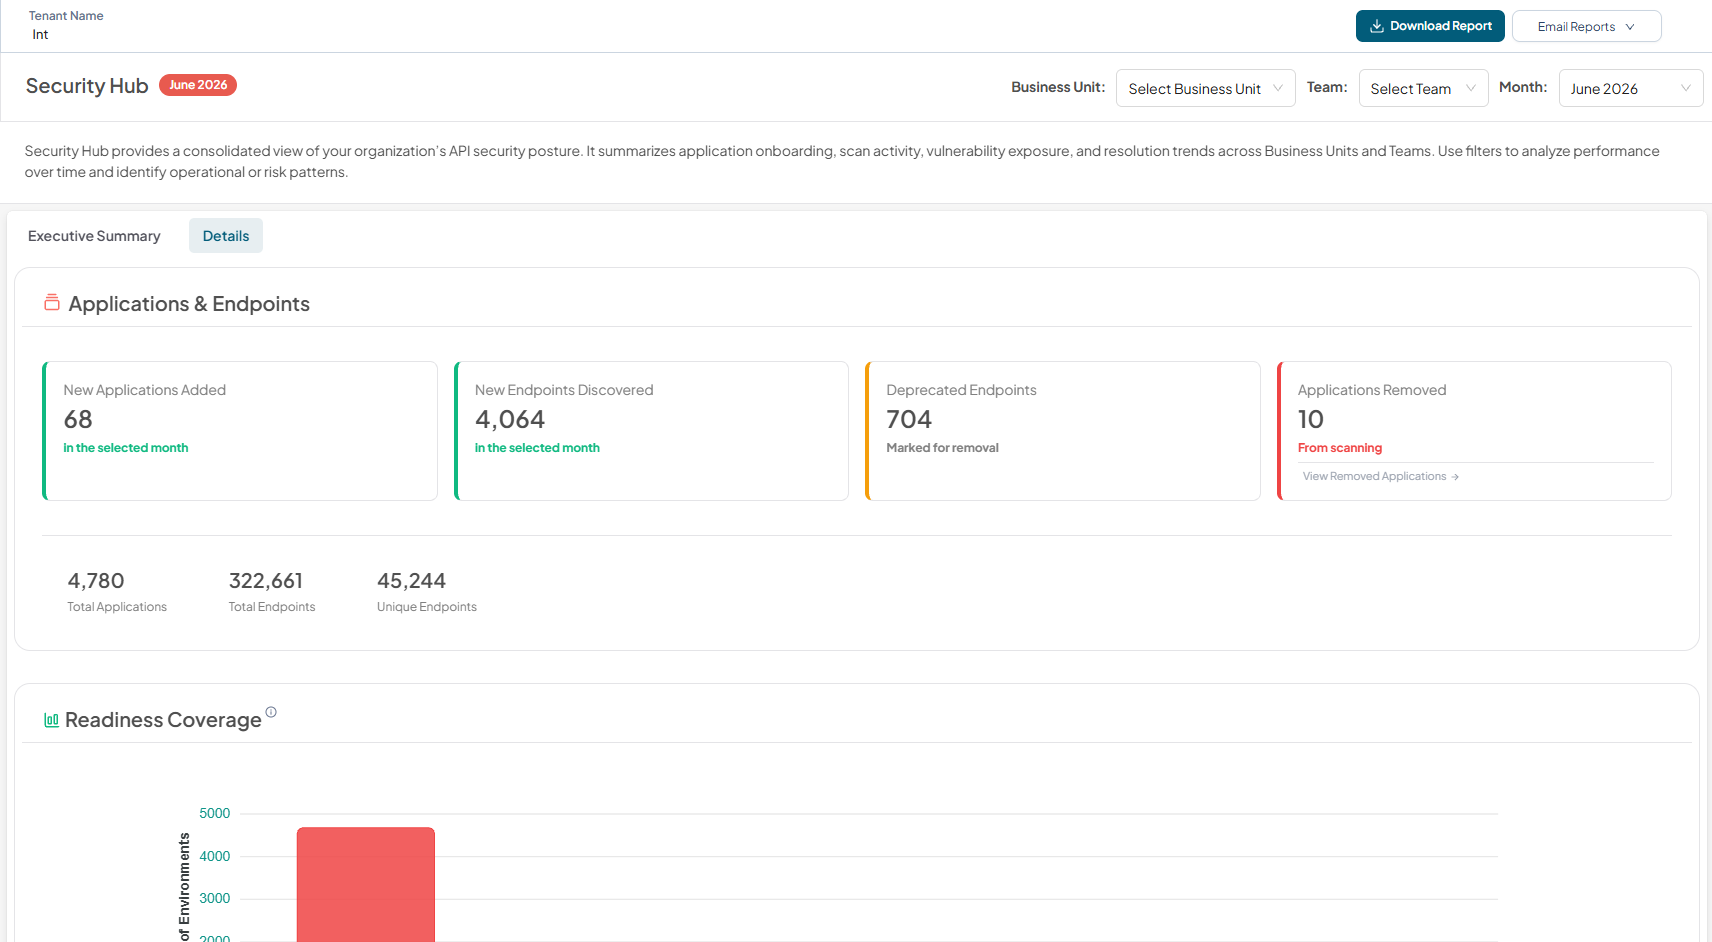
Security Hub provides a consolidated view of your organization’s API security posture. It summarizes application onboarding, scan activity, vulnerability exposure, and resolution trends across Business Units and Teams. Use filters to analyze performance over time and identify operational or risk patterns.
Visit Security Hub.
-
Open your browser and visit: https://<your-tenant>.apisecapps.com
-
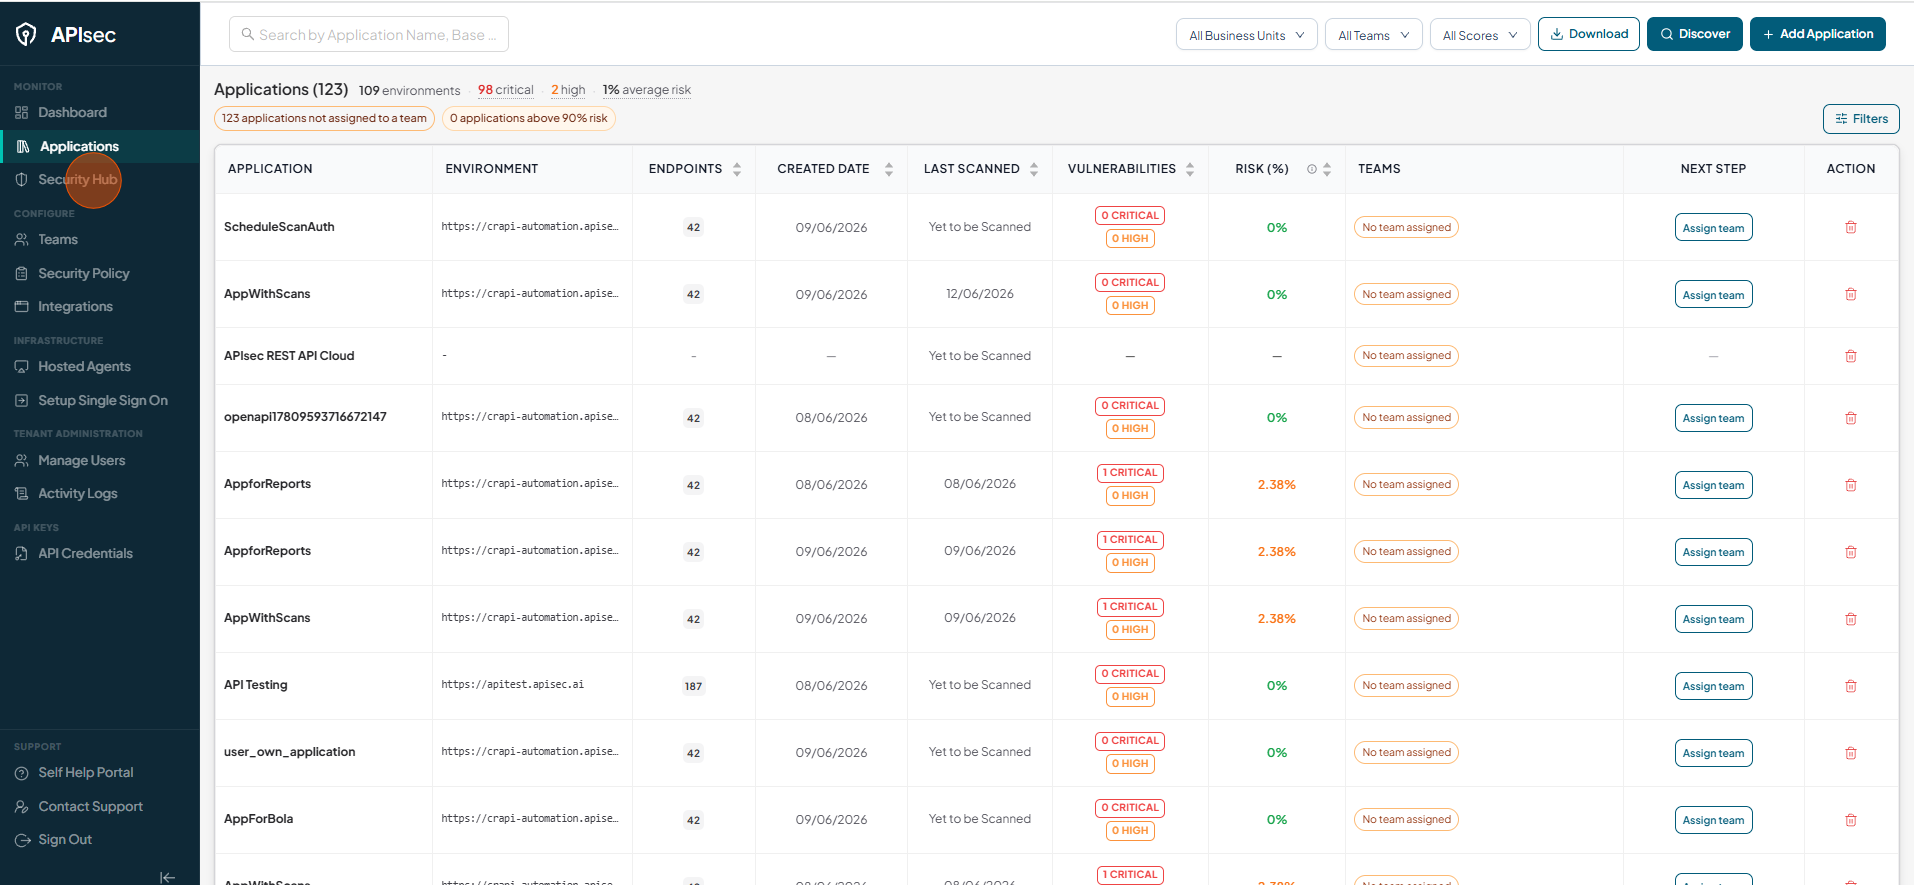
Click "Security Hub" present on the left panel.
-
Security Hub page gets displayed
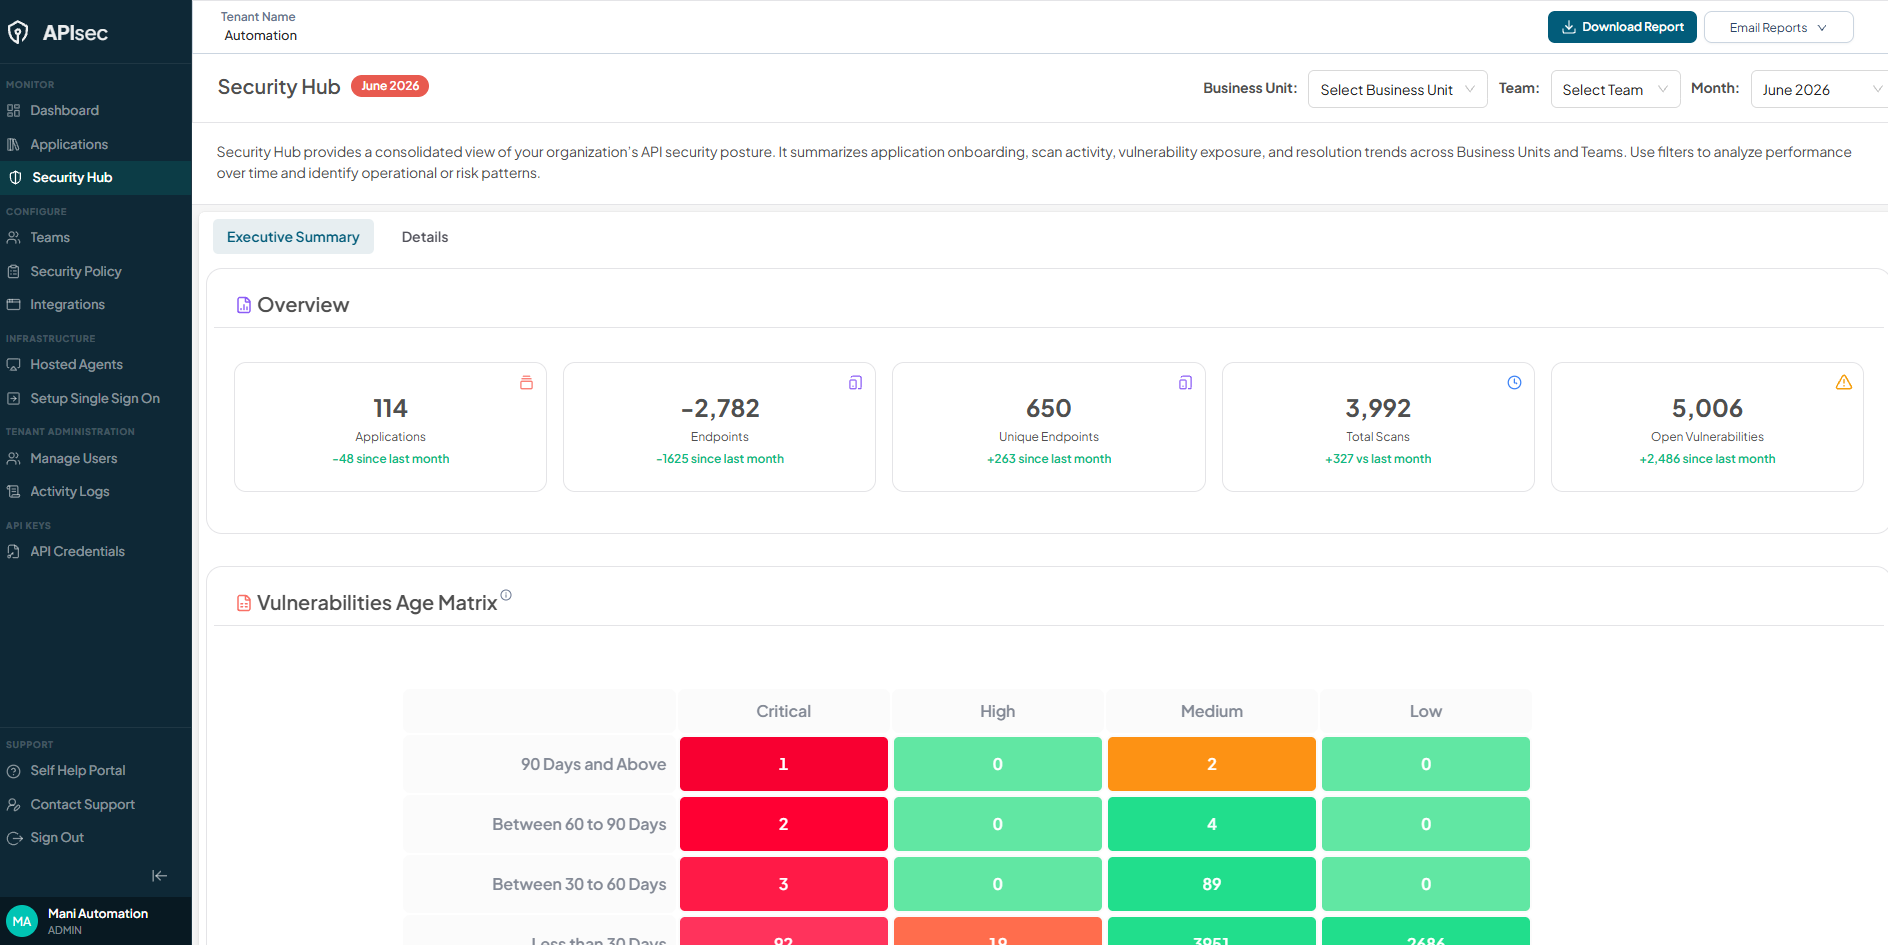
Executive Summary
The Executive Summary provides a high-level snapshot of the platform’s current security and scanning posture, enabling stakeholders to quickly understand overall application coverage, API surface exposure, scan activity, and unresolved vulnerability risk.
The Executive Summary contains four major sections:
- Overview
- Vulnerability Age Matrix
- Open Vulnerabilities Trend
- Vulnerability Resolution Trend
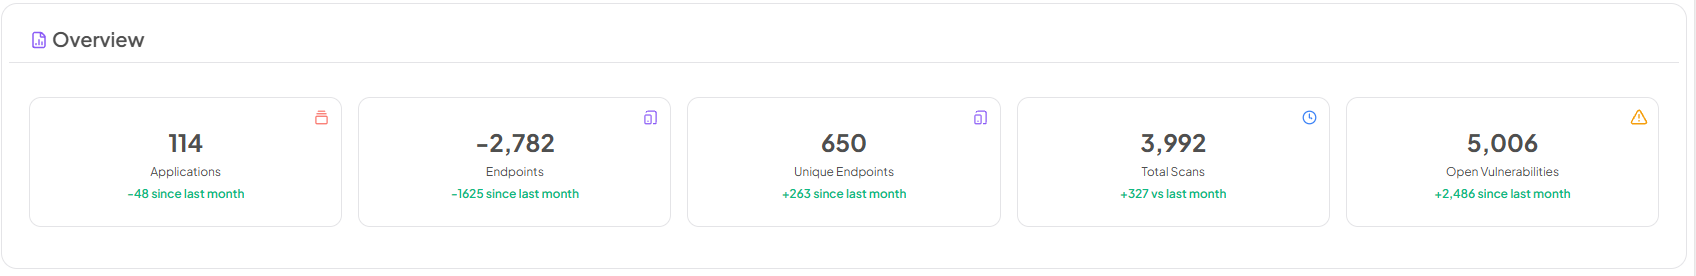
Overview
Displays aggregated counts for the selected month, Business Unit, and Team, covering the total number of onboarded applications, discovered endpoints across applications, executed security scans, and unresolved vulnerabilities across all applications and endpoints.
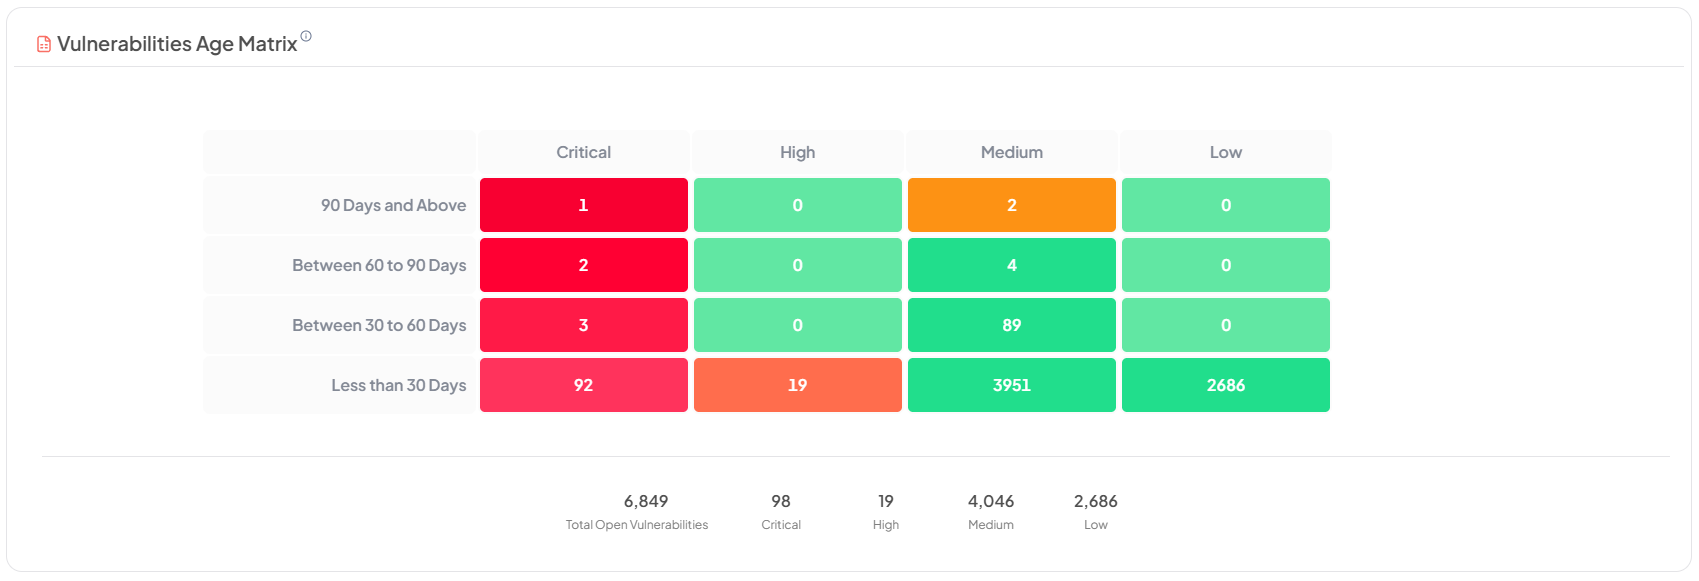
Vulnerabilities Age Matrix
-
Displays open vulnerabilities categorized by age and severity for the selected Business Unit and Team. This matrix helps identify prolonged exposure and prioritization gaps.
-
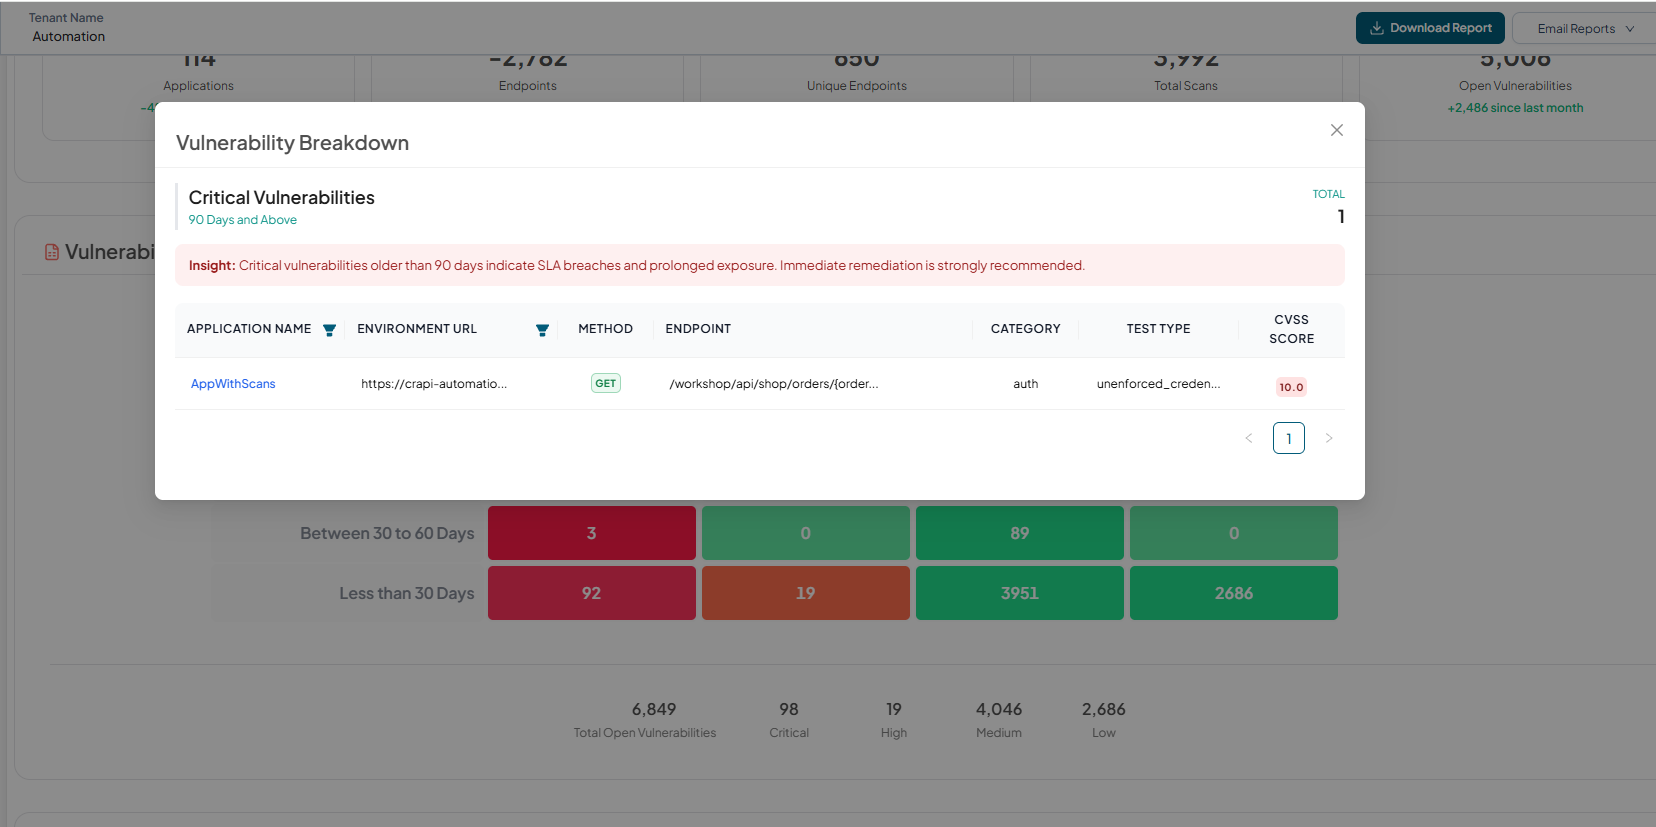
Each cell in the Vulnerability Age Matrix is interactive. Selecting a cell opens a Vulnerability Breakdown panel that displays detailed information about the unresolved vulnerabilities corresponding to the chosen:
- Severity level (Critical, High, Medium, Low)
- Age range (e.g., Less than 30 days, 30–60 days, 60–90 days, 90+ days)
-
To view vulnerabilities that are Critical and aged 90 days and above, select the corresponding cell in the matrix.
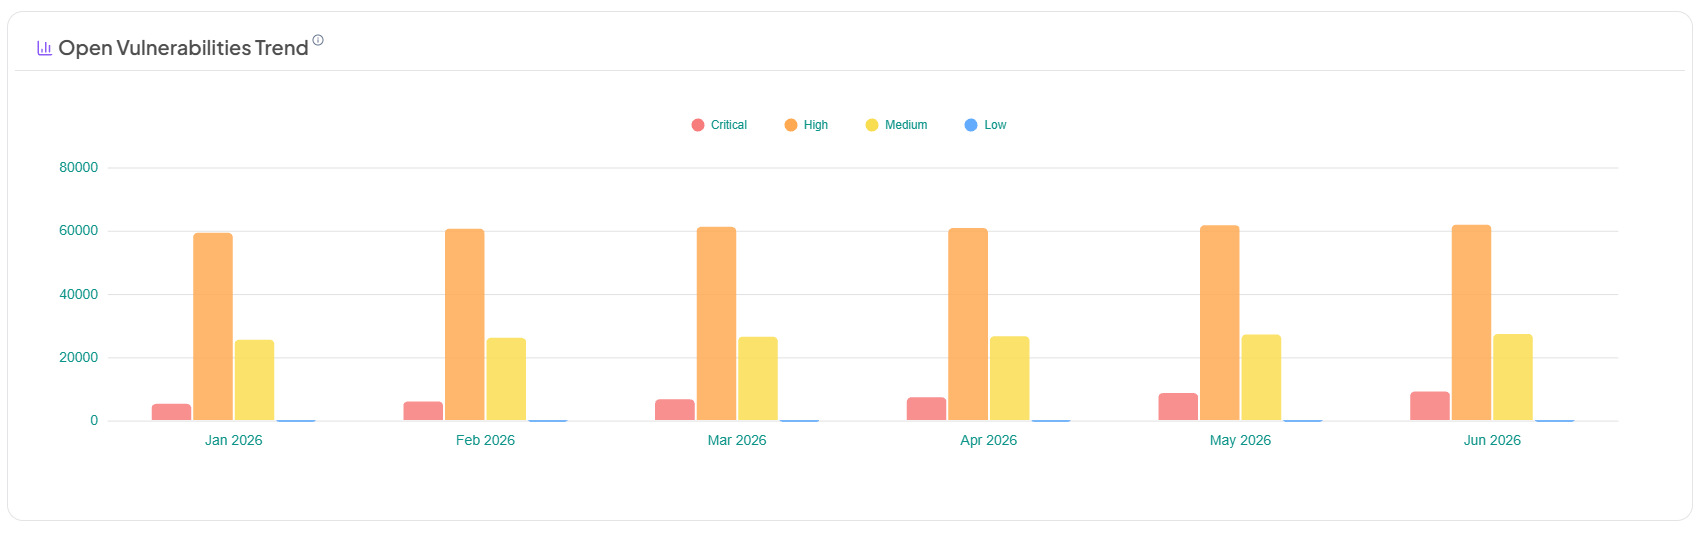
Open Vulnerabilities Trend
Displays the month-over-month trend of open vulnerabilities, categorized by severity, for the selected Business Unit and Team. The chart displays the current month and the previous five months. Values represent the total number of unresolved vulnerabilities at the end of each month.
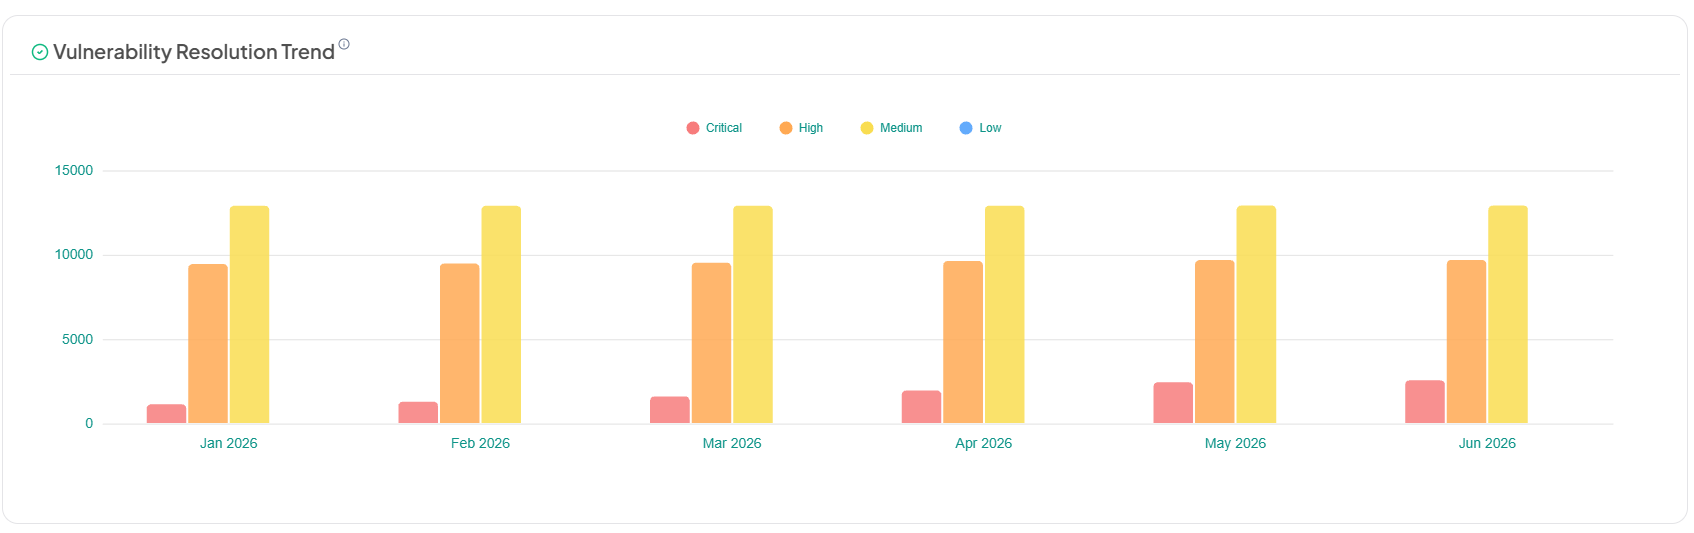
Vulnerability Resolution Trend
Displays the month-over-month trend of resolved vulnerabilities, categorized by severity, for the selected Business Unit and Team. The chart displays the current month and the previous five months. Values represent the total number of resolved vulnerabilities at the end of each month.
Detailed Summary
The Detailed Summary dashboard offers an in-depth analysis of the organization’s API security posture within the selected Business Unit, Team, and reporting period. It provides actionable operational insights to help security and engineering teams oversee onboarding activity, manage endpoint lifecycle transitions, analyze coverage maturity, evaluate vulnerability exposure, and monitor scan performance.
The Detailed Summary contains four major sections:
- Applications & Endpoints
- Readiness Coverage
- Top 5 Vulnerable Applications
- Failed Scans
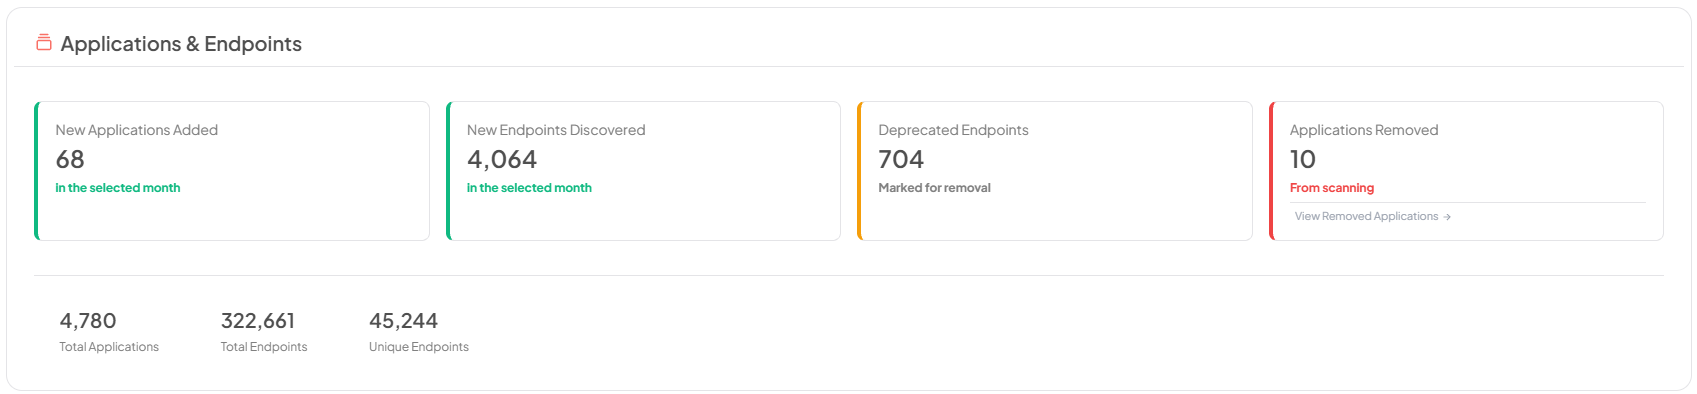
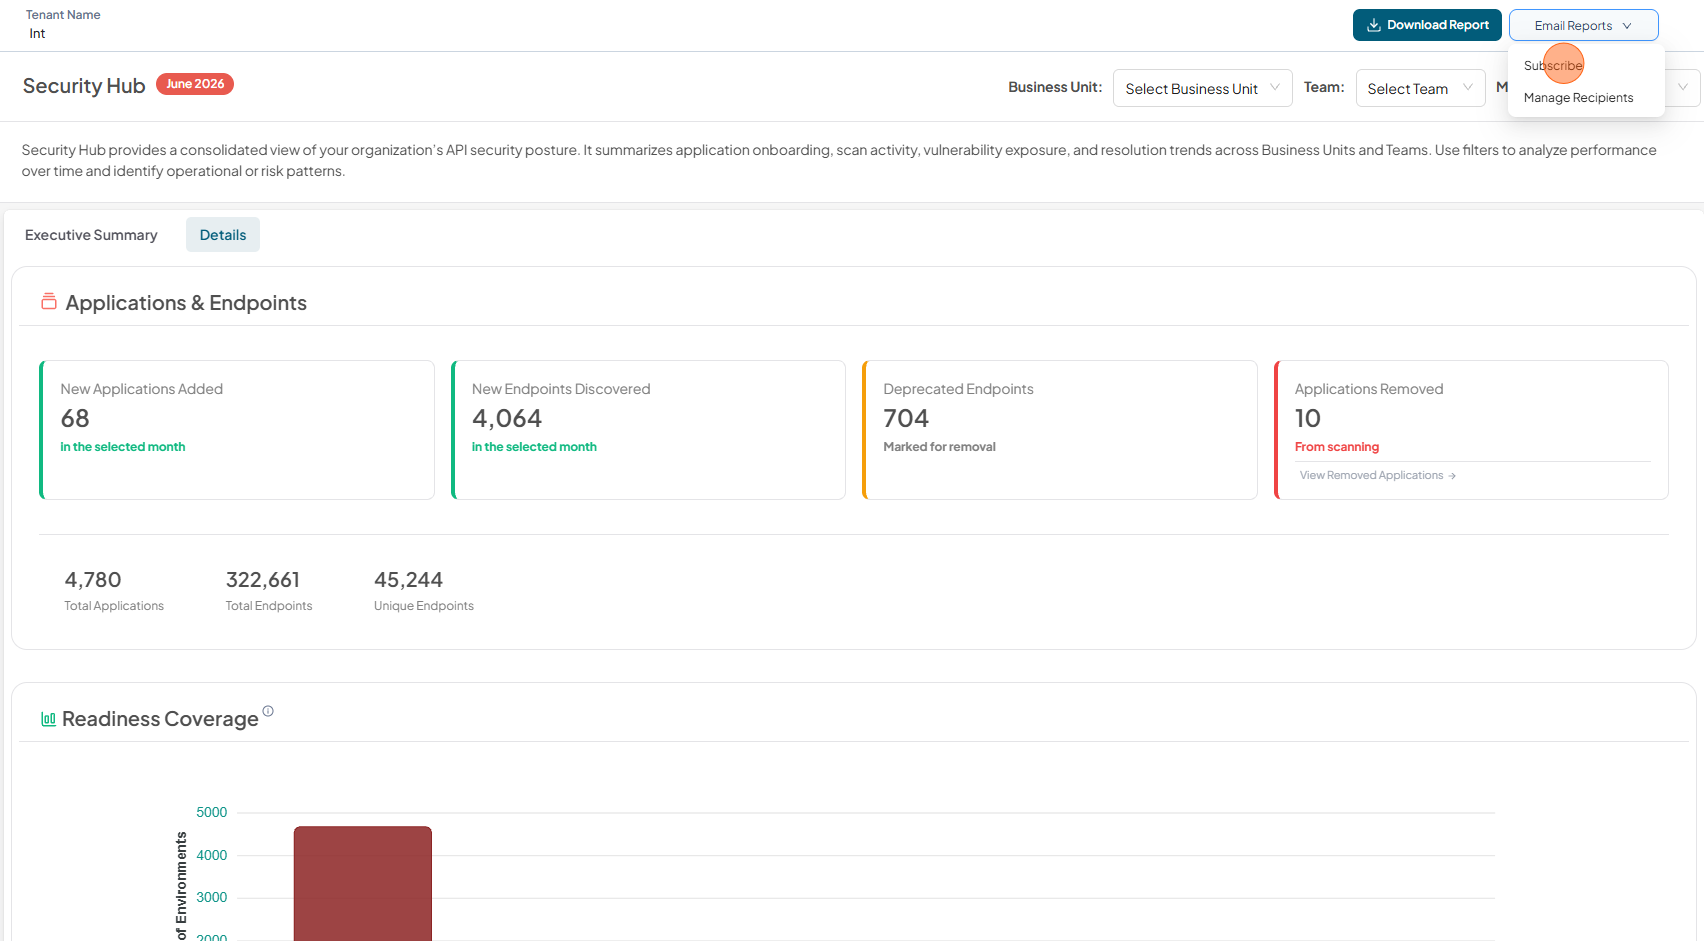
Applications & Endpoints
The Applications & Endpoints section delivers insight into application and API changes during the selected reporting period. It enables teams to track new application onboarding, endpoint discovery, deprecations, application removals, total applications, total endpoints, and unique endpoints providing operational visibility into API surface evolution and asset governance.
Readiness Coverage
Displays the distribution of application instances based on endpoint readiness coverage for deeper security testing. When a month is selected, instances are classified using historical readiness data for the selected month into predefined coverage ranges. Click on a range to view the instances in that category.
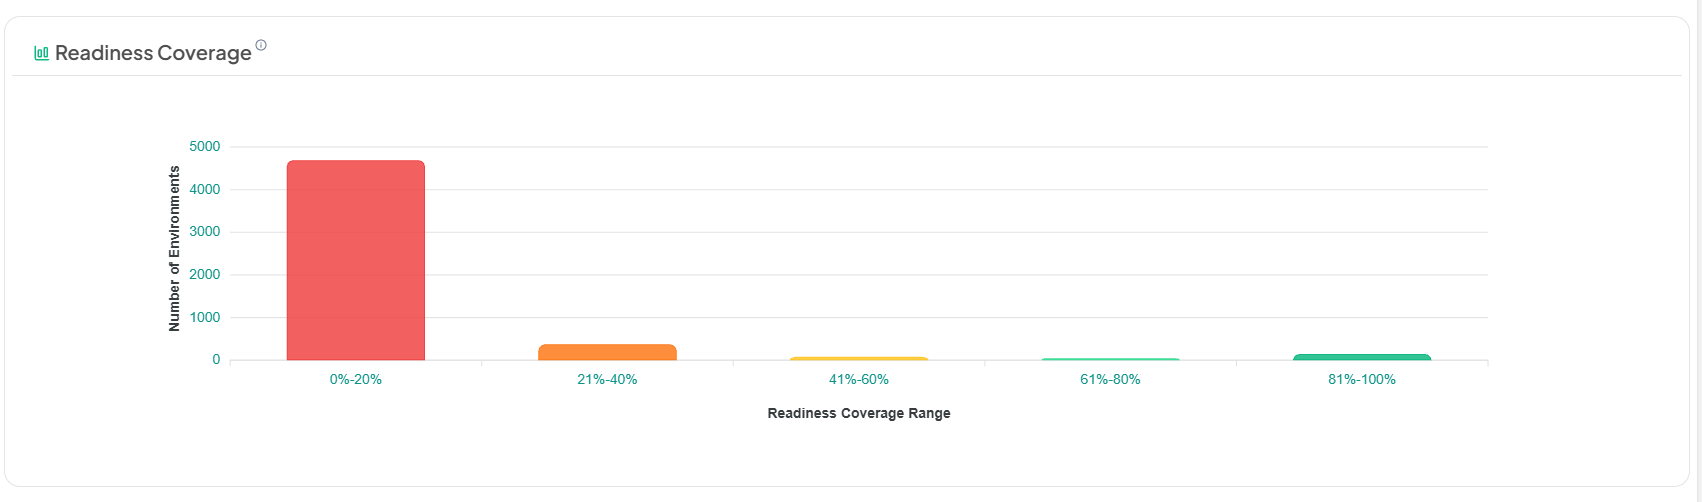
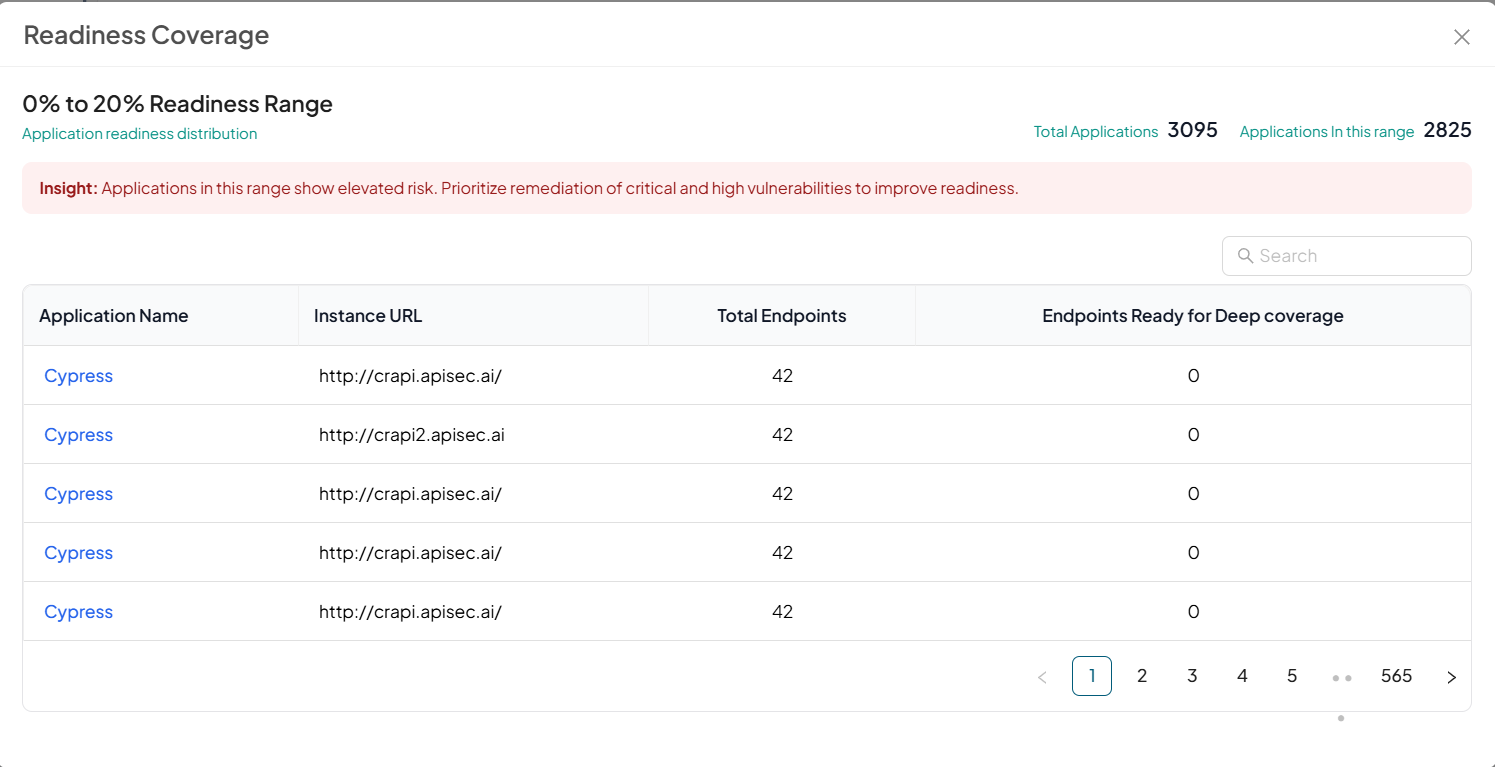
Each bar in the Readiness Coverage chart is interactive. Selecting a coverage range opens a detailed view displaying the application instances that fall within the selected readiness band for the chosen month.
The drill-down panel includes:
- The selected readiness range (e.g., 0%–20%)
- Total number of applications in scope
- Number of applications within the selected coverage range
This provides immediate visibility into the proportion of applications requiring attention.
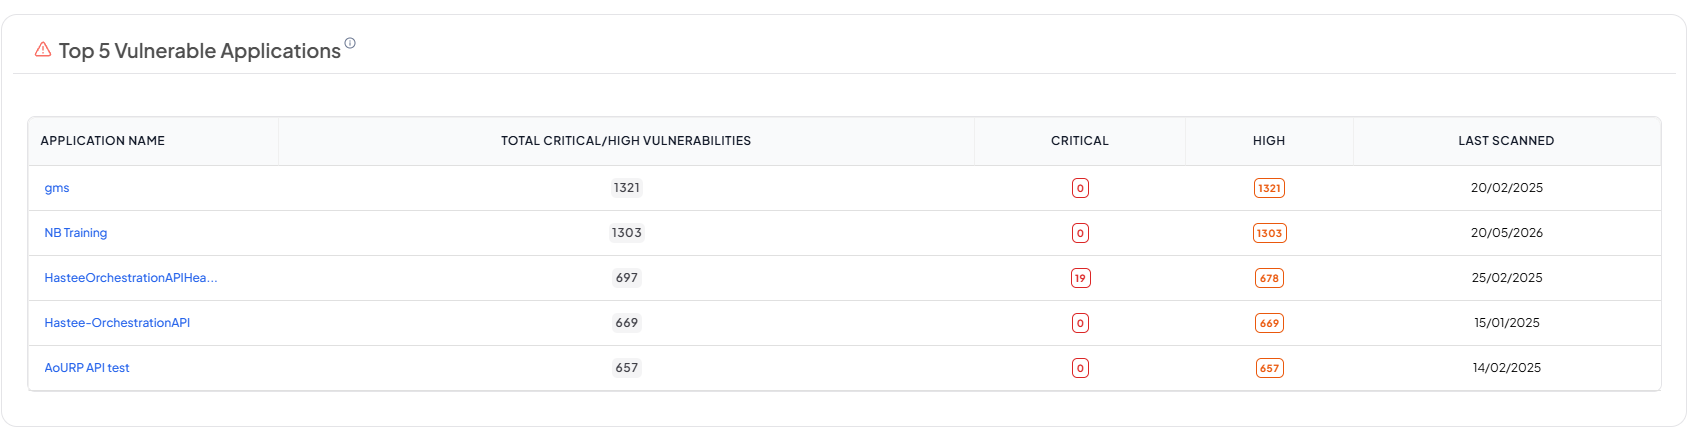
Top 5 Vulnerable Applications
Displays the top five applications with the highest number of Critical and High severity vulnerabilities across all instances, filtered by Business Unit and Team. Vulnerabilities are aggregated across instances to highlight applications requiring immediate remediation. Clicking an application opens one of its instances, where users can switch between other instances to review associated vulnerabilities.
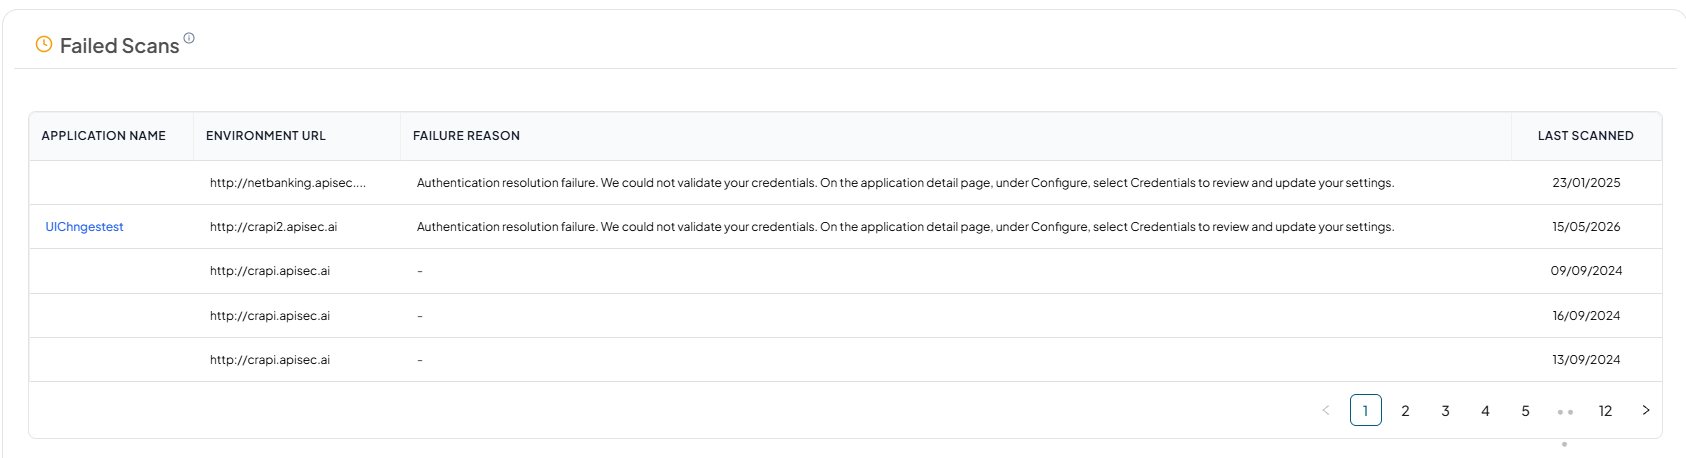
Failed Scans
Displays application instances where the latest scan attempt failed due to configuration, authentication, or connectivity issues, filtered by Business Unit and Team. Only current unresolved failures are shown, with one entry per application, instance URL, and scan type. Authenticated and unauthenticated scans are tracked independently, and entries are removed only when a successful scan of the same type replaces the failed state.
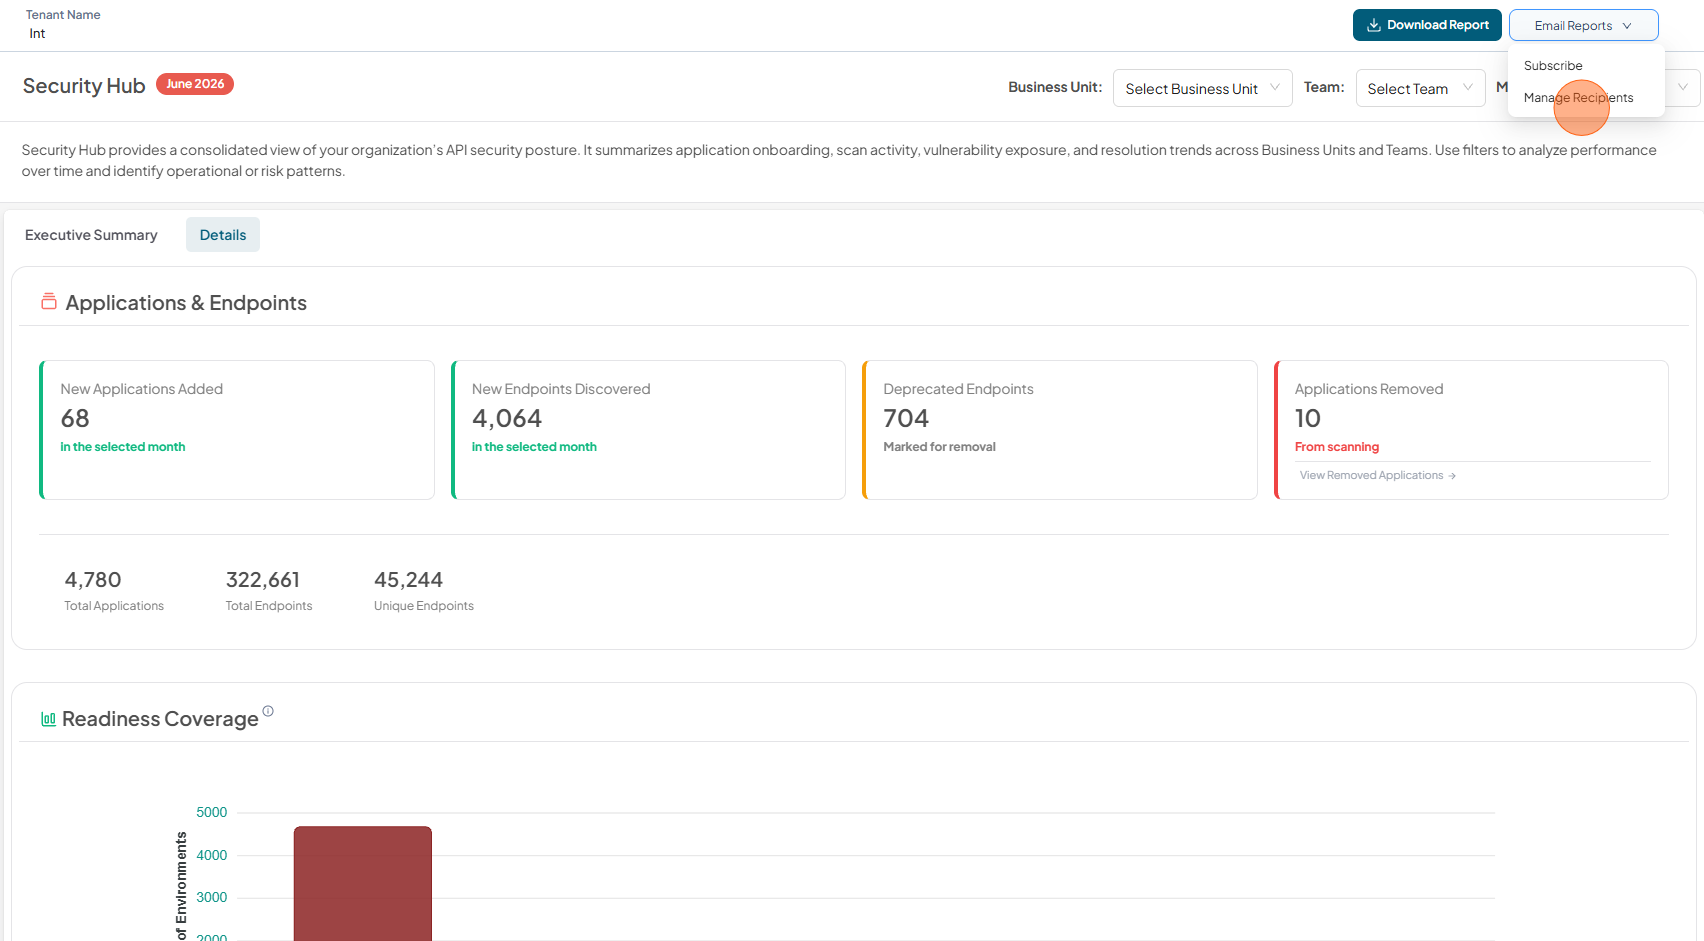
Email Reports
Subscribe
The Email Reports option allows users to subscribe to receive automated monthly security reports. By selecting Subscribe, users will receive a consolidated report covering the selected Business Unit and Team.
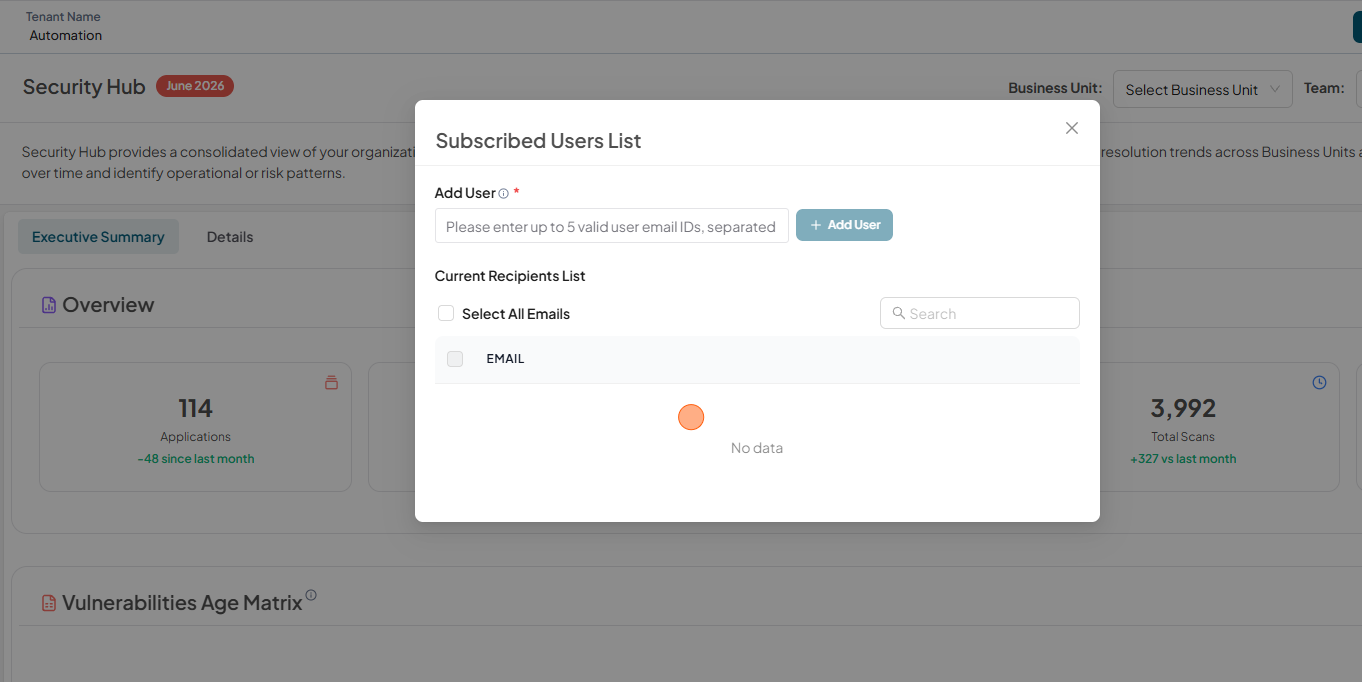
Manage Recipients
The Manage Recipients option allows administrators to add or remove email recipients for the monthly security report. This enables reports to be shared with stakeholders who may not have direct access to the platform but require visibility into the organization’s API security posture.
Only users with administrative privileges can manage recipients. Changes made here determine who receives the automated monthly security reports for the selected scope.
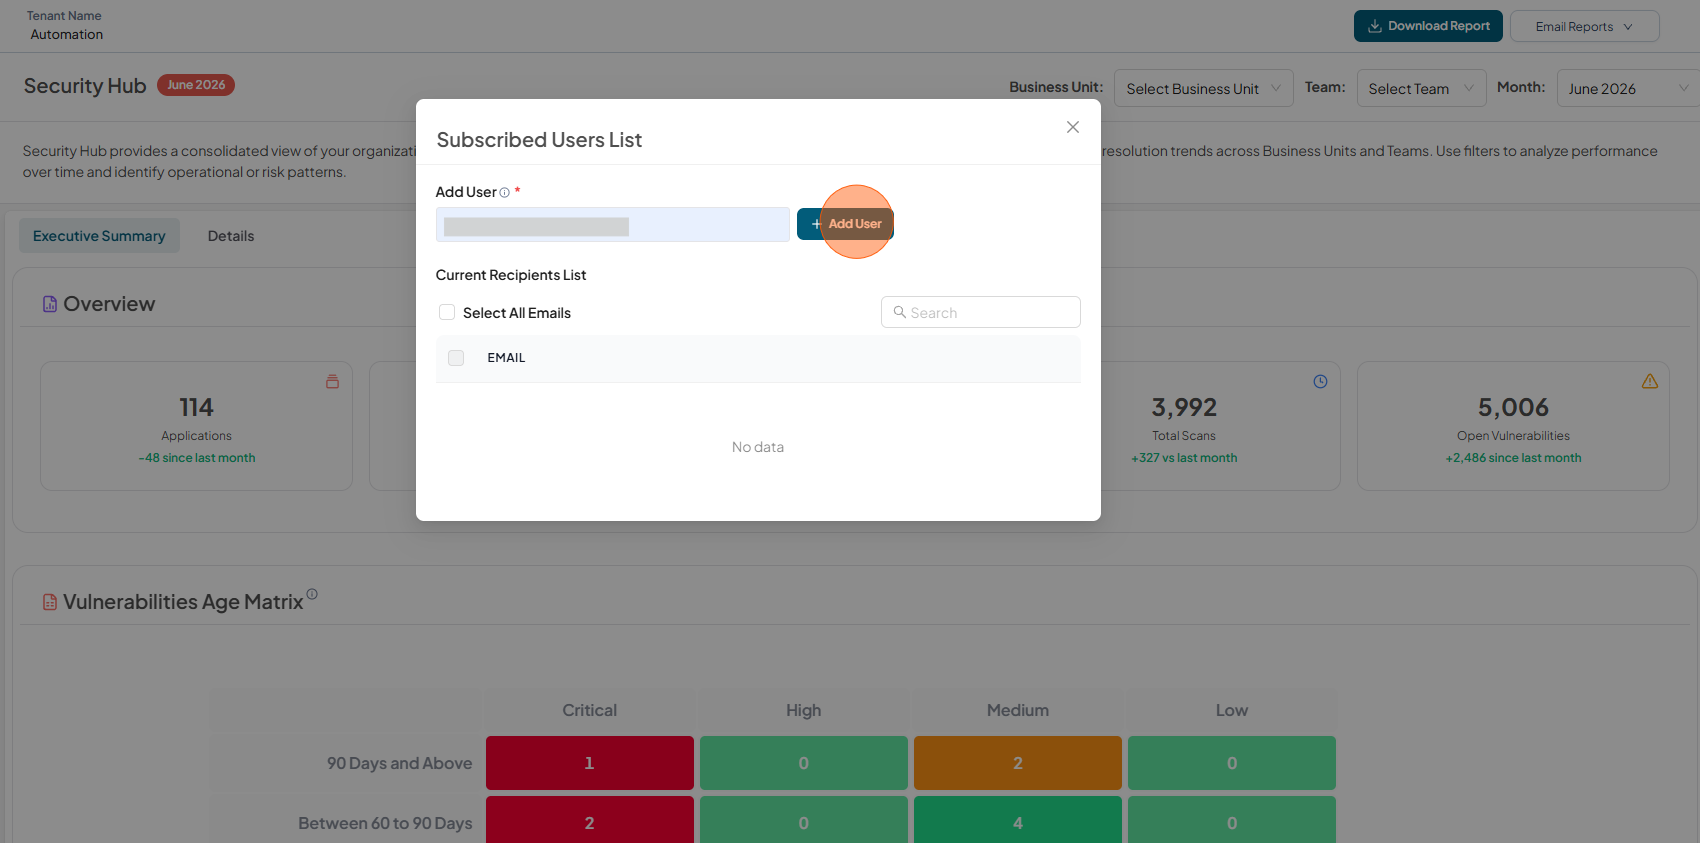
Add User
To add user to the Subscribed Users List
-
Click Manage Recipients
-
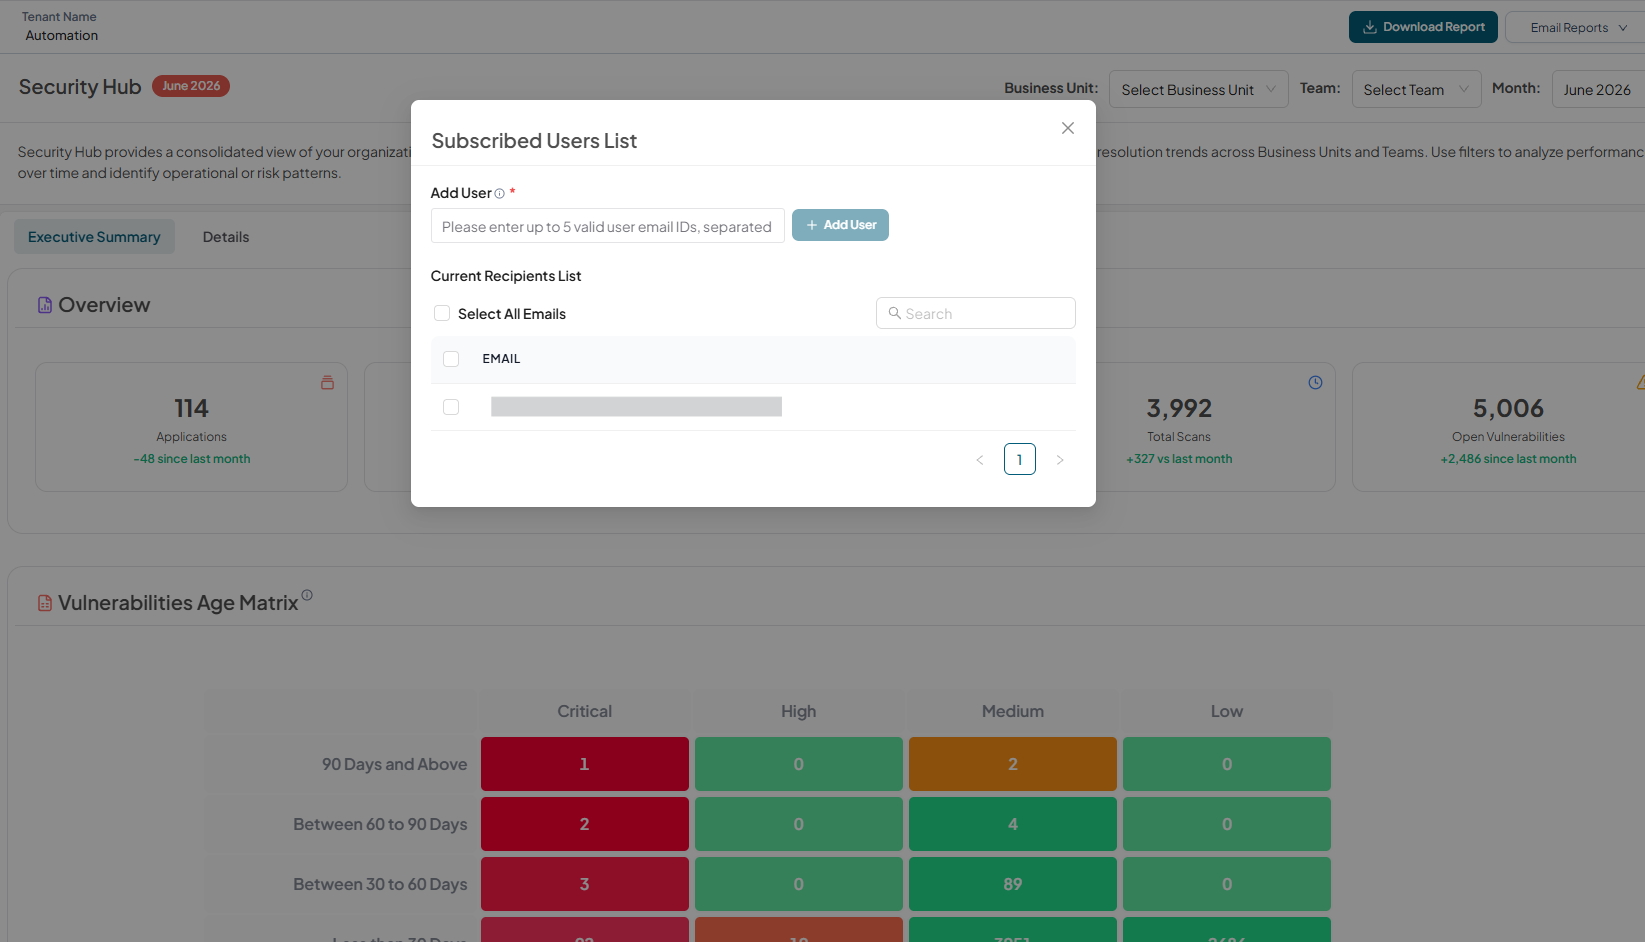
Enter email address and click Add User
-
Verify the added user email.
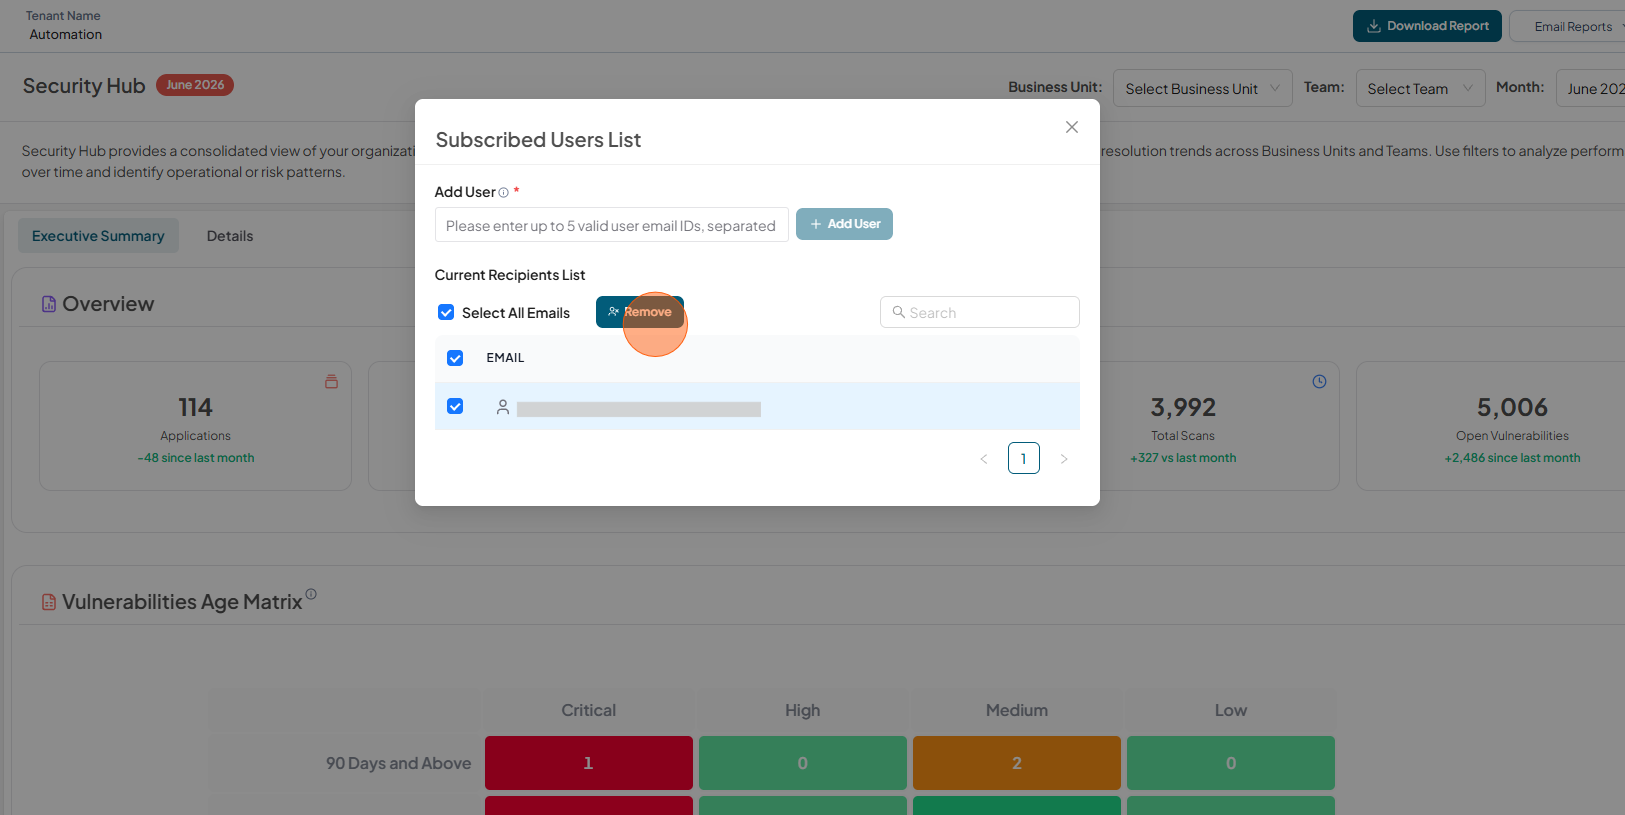
Remove User
To remove user from the Subscribed Users List
-
Click Manage Recipients
-
Select the user email to remove and click Remove.
-
Verify that the user is not in the list