Dashboard
The Dashboard provides a centralized view of your organization's API security exposure, onboarding progress status. It enables administrators to quickly assess application health, identify onboarding gaps, and monitor security exposure from a single location.
Benefits
- Monitor onboarding progress across registered applications.
- Track overall security exposure across scanned applications.
- Navigate directly to detailed onboarding and exposure views.
Accessing the Dashboard
-
Open your browser and visit: https://<your-tenant>.apisecapps.com
-
Click Dashboard
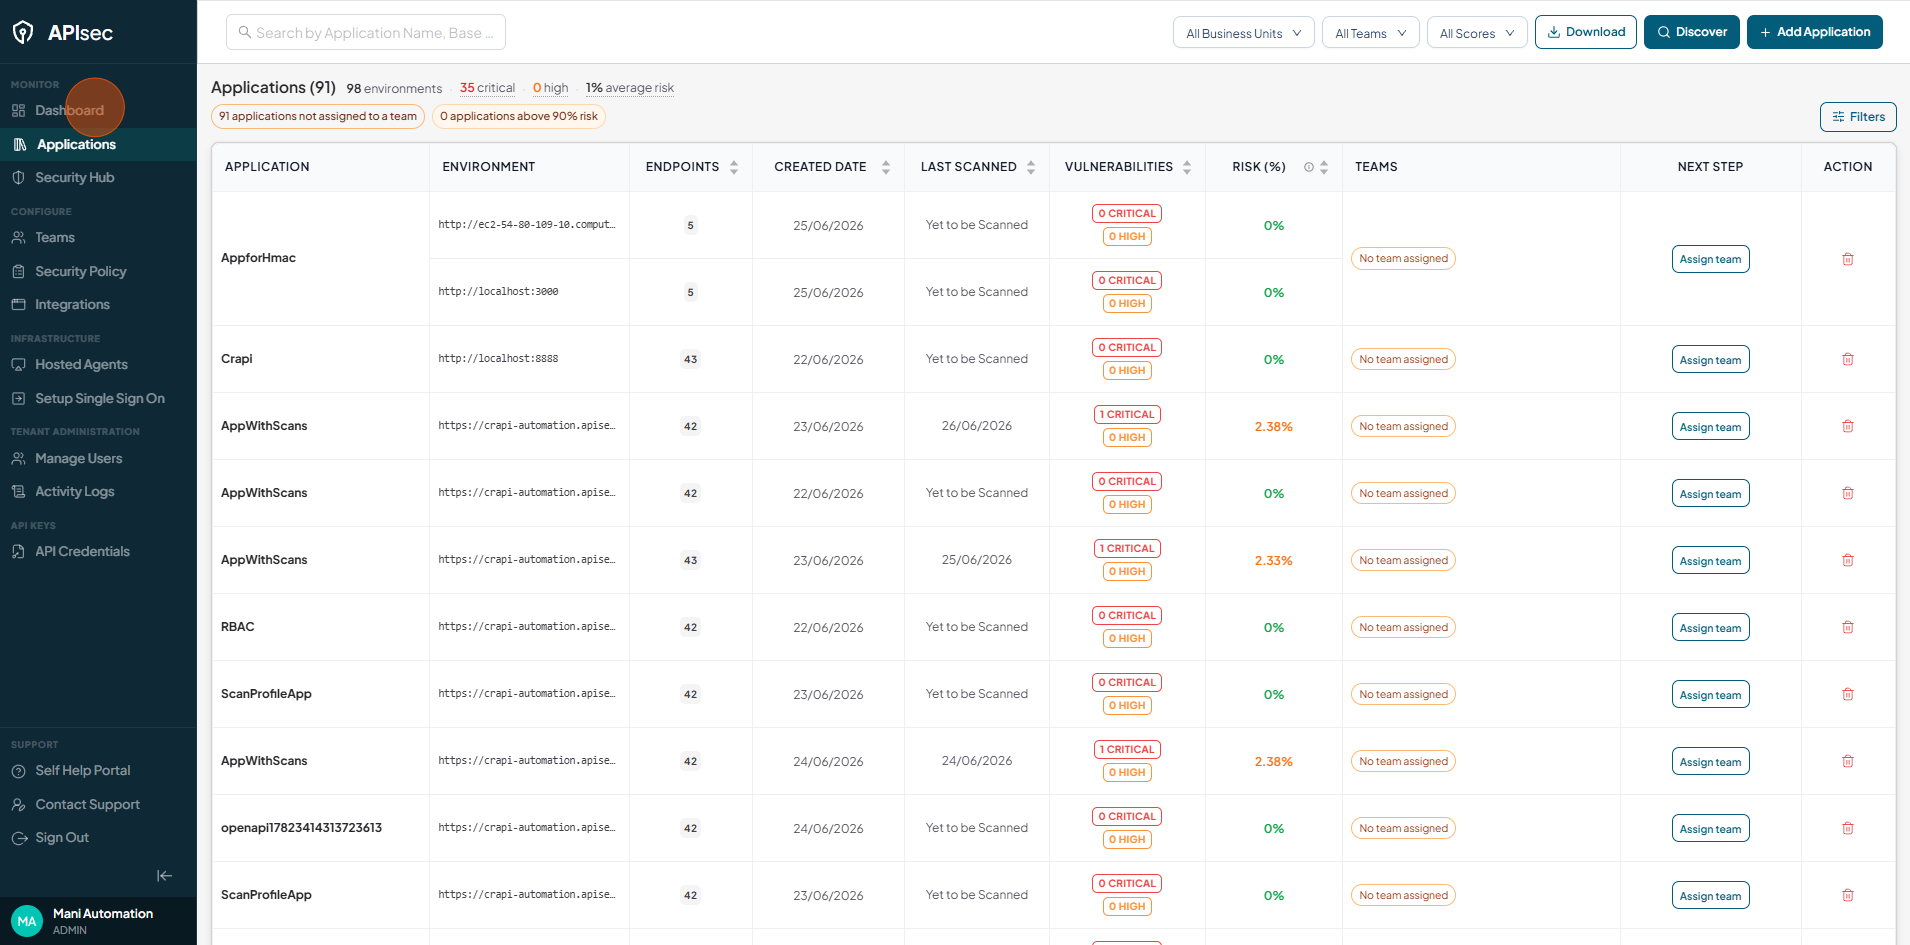
-
Now The Dashboard page is displayed,
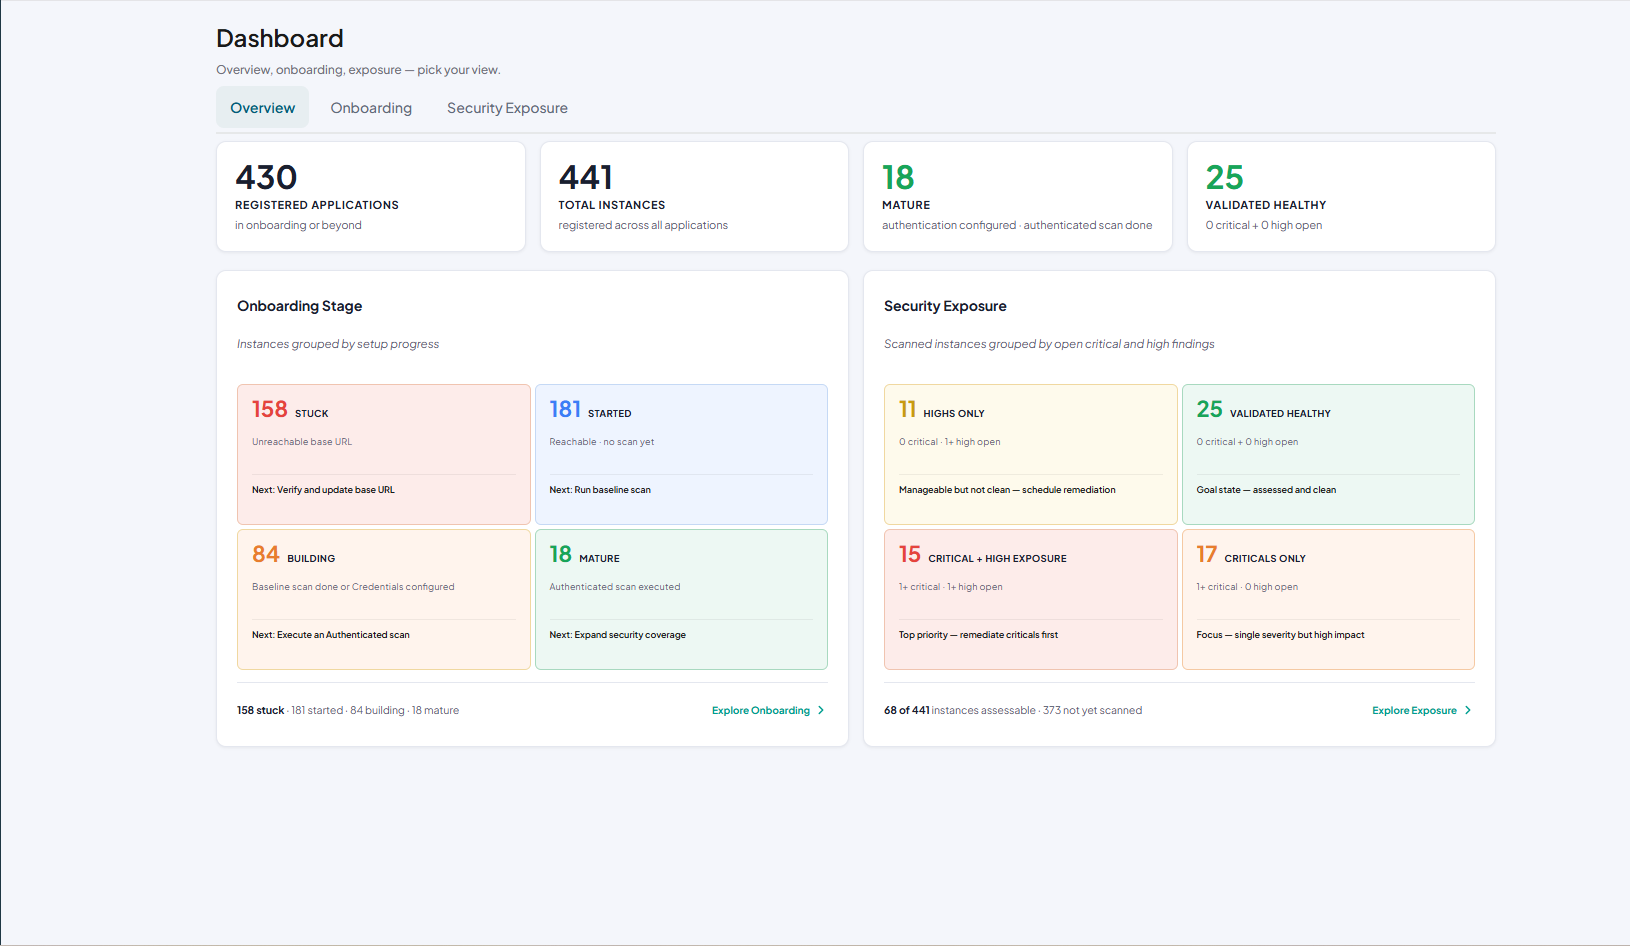
It consists of three primary sections:
- Overview
- Onboarding
- Security Exposure
Overview
The Overview tab provides a centralized summary of your tenant's application onboarding progress and security exposure. It presents key metrics, onboarding status, and security exposure, enabling you to quickly identify applications that require attention.
Summary
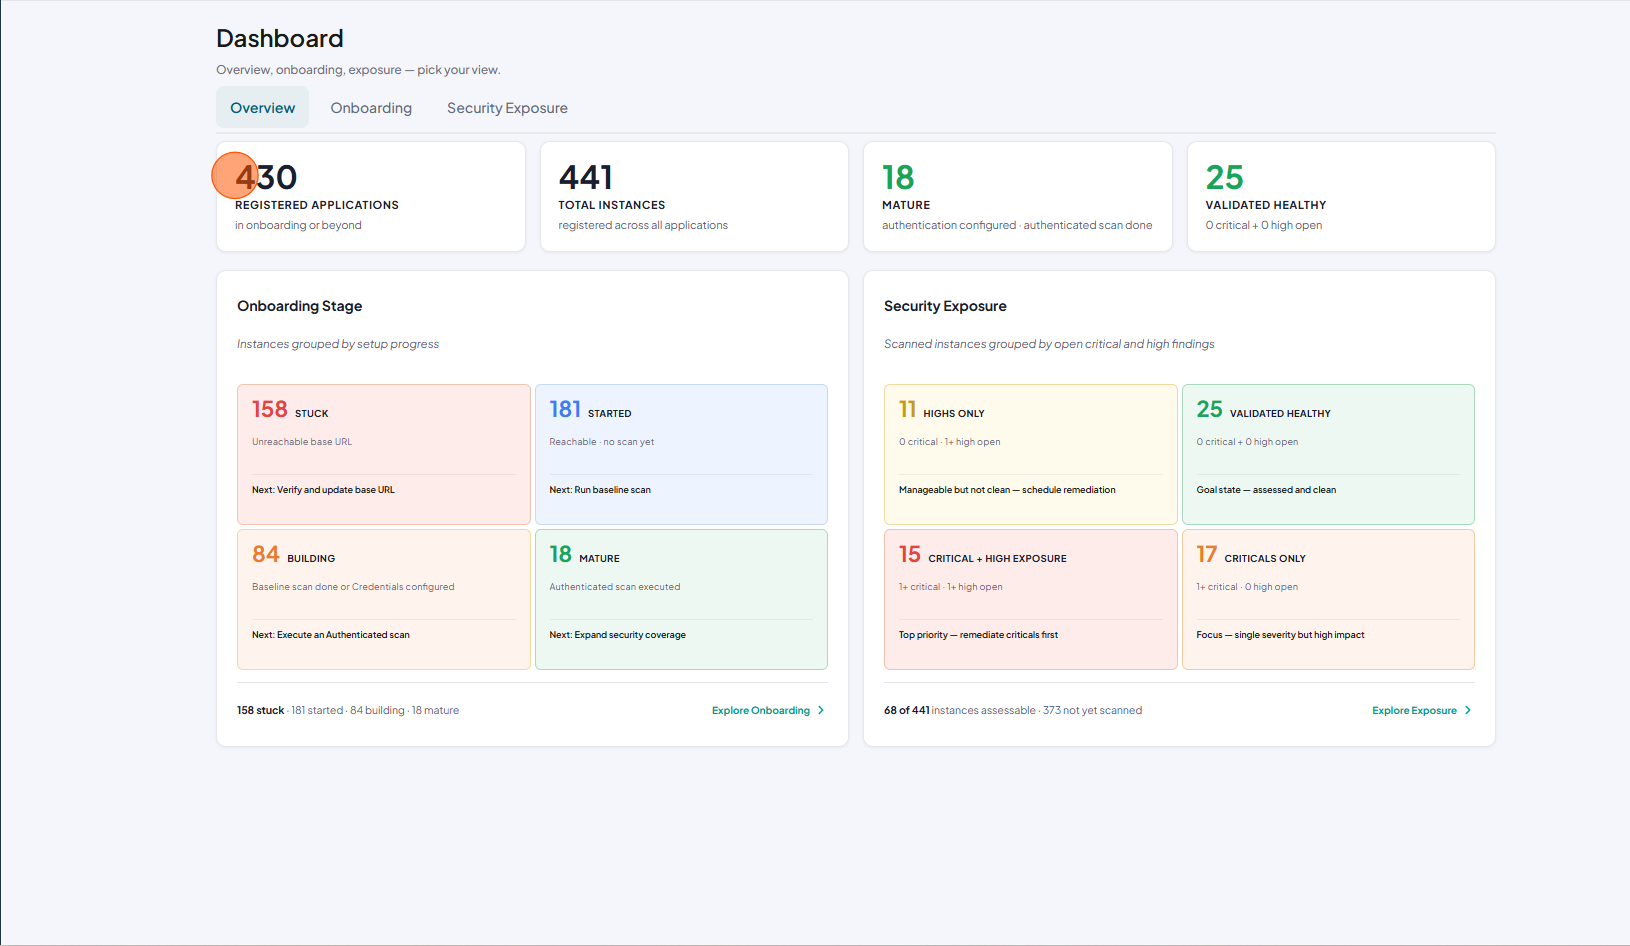
The summary cards at the top of the page provide an at-a-glance view of your tenant's onboarding and security status.
-
Registered Applications
Displays the total number of applications that have been registered in the platform, including applications that are currently onboarding as well as those that have completed onboarding.
This metric helps you understand the overall size of your application inventory.
-
Total Instances
Displays the total number of application instances registered across all applications.
Since an application can contain multiple instances (for example, Development, QA, and Production), this metric reflects the complete instance count within the tenant.
-
Mature
The Mature state displays the number of application instances where authentication is configured or an authenticated scan has been completed.
These instances represent applications with a mature onboarding configuration that requires minimal maintenance.
-
Validated Healthy
Displays the number of assessed instances that have:
- 0 Critical vulnerabilities
- 0 High severity vulnerabilities
These applications represent the desired security state and require no immediate remediation for Critical or High findings.
The Onboarding Stage section provides a high-level view of the onboarding progress of your registered application instances. It categorizes instances based on their current onboarding activities and setup status, helping you track progress, identify applications that require attention, and determine the next steps toward achieving a Mature state.
- Click Explore Onboarding to navigate to Onboarding tab for detailed view
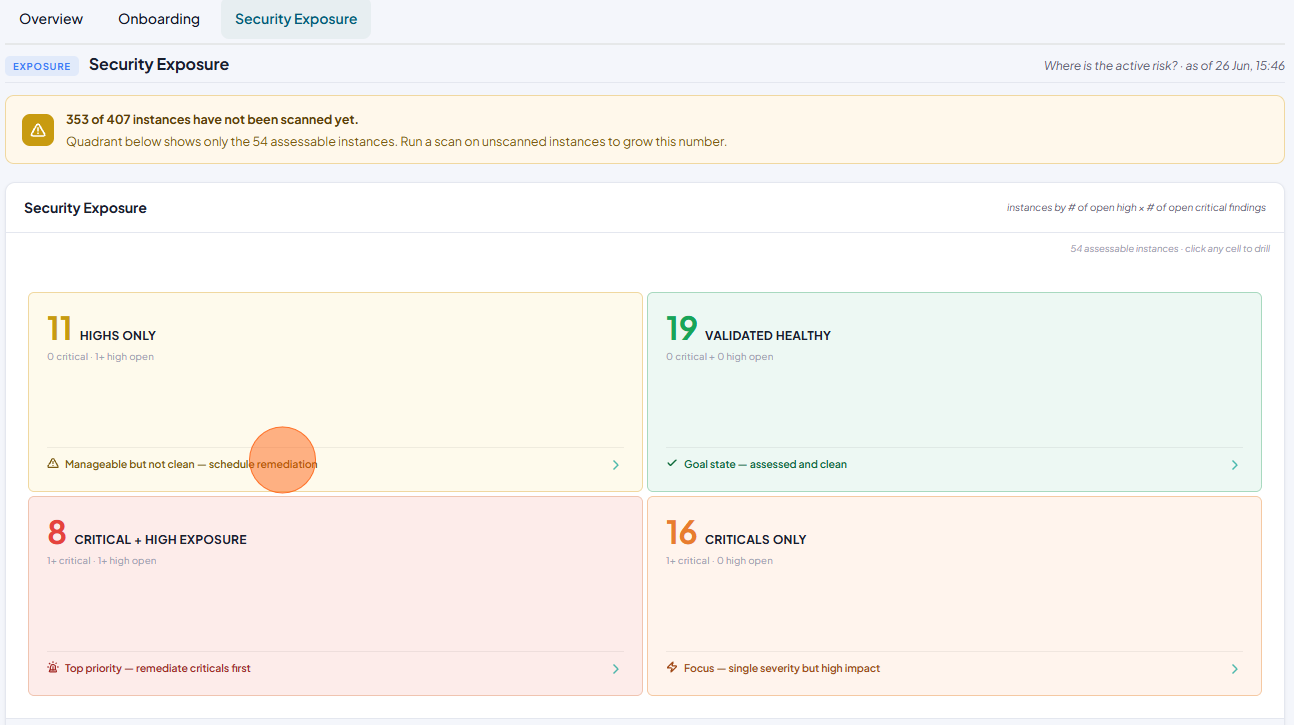
Security Exposure provides a high-level summary of the security exposure of your application instances. It categorizes assessed instances based on the presence of open Critical and High severity vulnerabilities, helping you identify applications with critical exposure, high-only findings, or a validated healthy security state to prioritize remediation efforts.
- Click Explore Exposure to navigate to Security Exposure tab for detailed view
Onboarding
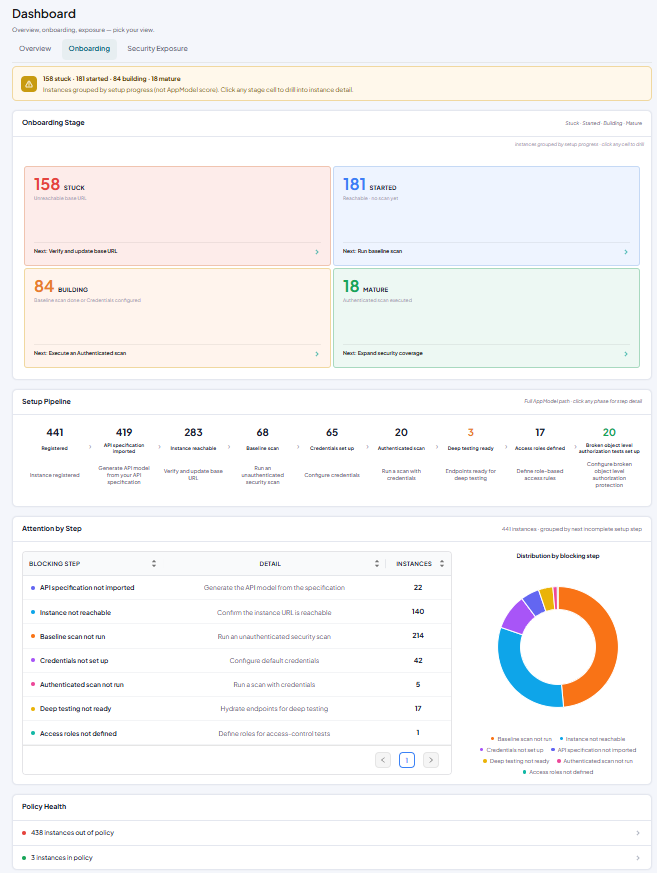
The Onboarding tab provides a comprehensive view of your application's onboarding maturity across the tenant. It helps you monitor onboarding progress, identify pipeline bottlenecks, and understand where application instances are blocked during the onboarding process.
Onboarding Distribution
The Onboarding Distribution section categorizes application instances according to their AppModel score and the number of days since registration.
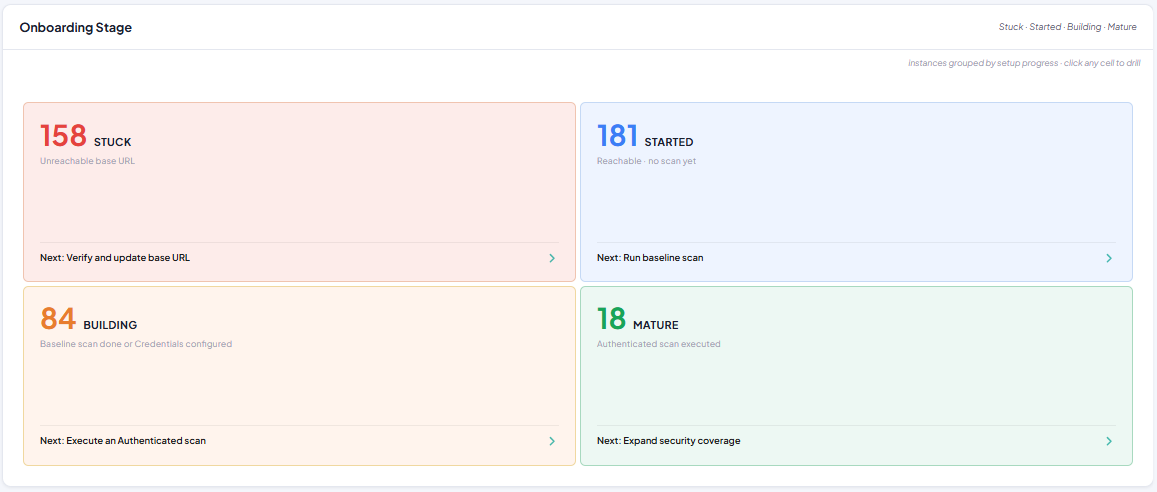
Applications are grouped into the following categories:
- Stuck: Application instances with an unreachable base URL that require the base URL to be verified or updated.
- Started: Application instances that are reachable but have not yet completed a baseline scan.
- Building: Application instances where the baseline scan is complete or credentials have been configured, and the next step is to execute an authenticated scan.
- Mature: Application instances where an authenticated scan has been executed, indicating that the application has progressed through the core onboarding steps.
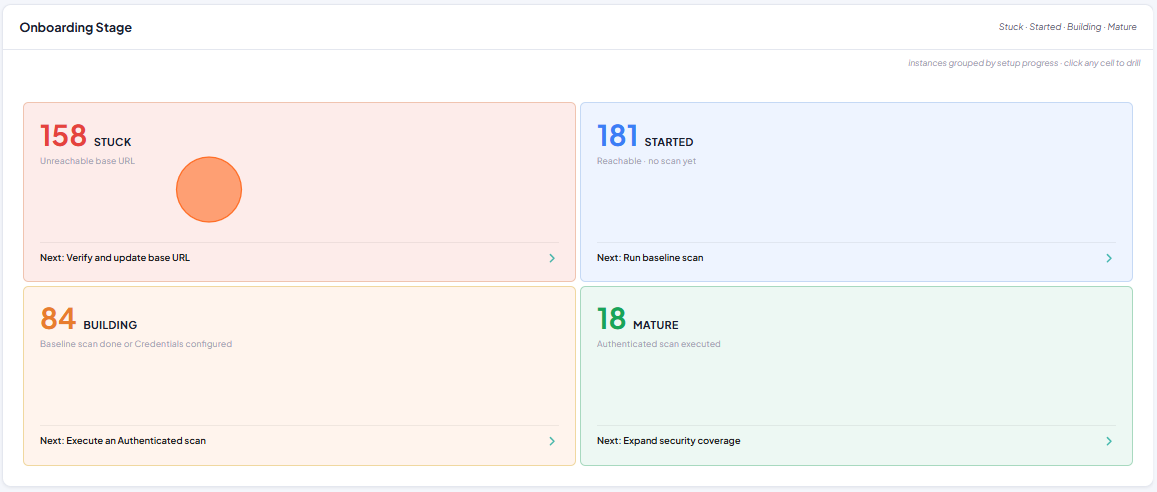
Click any category tile to view the application instances that belong to that onboarding stage.
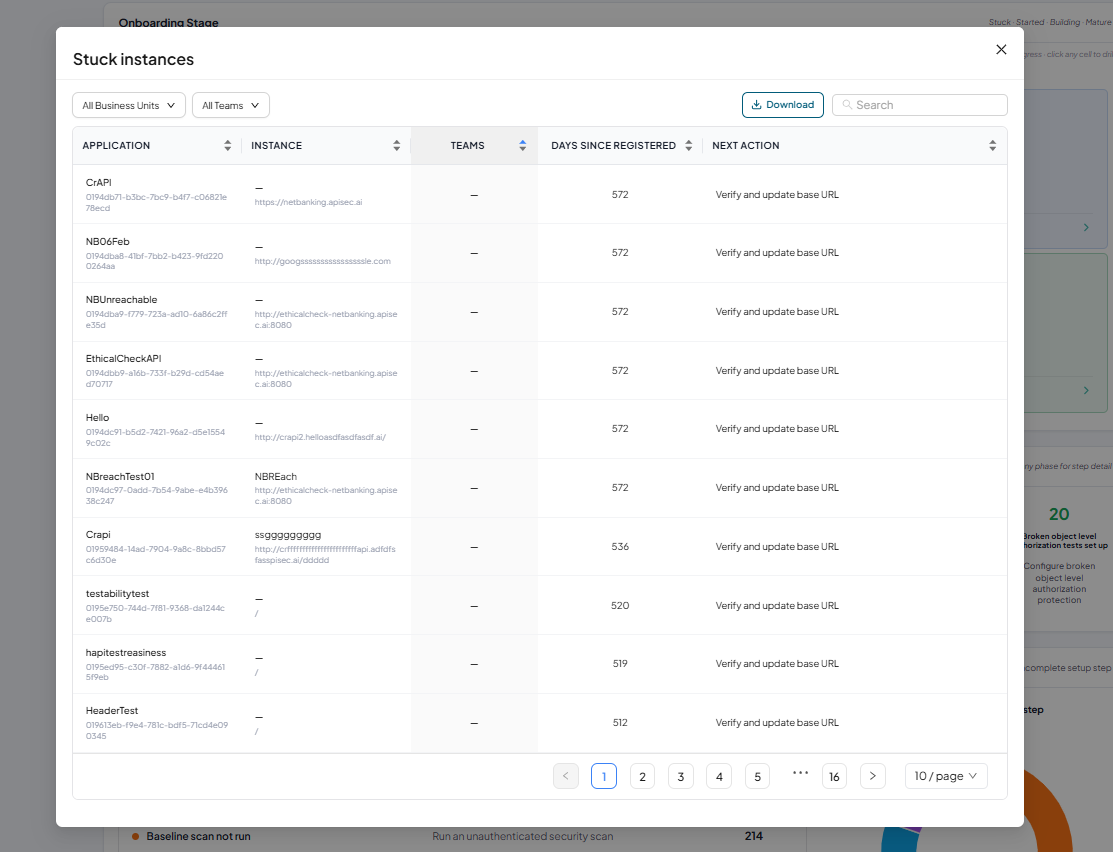
Click Download to export the displayed list of applications as a CSV file.
Use the All Business Units and All Teams filters to display applications that match the selected criteria.
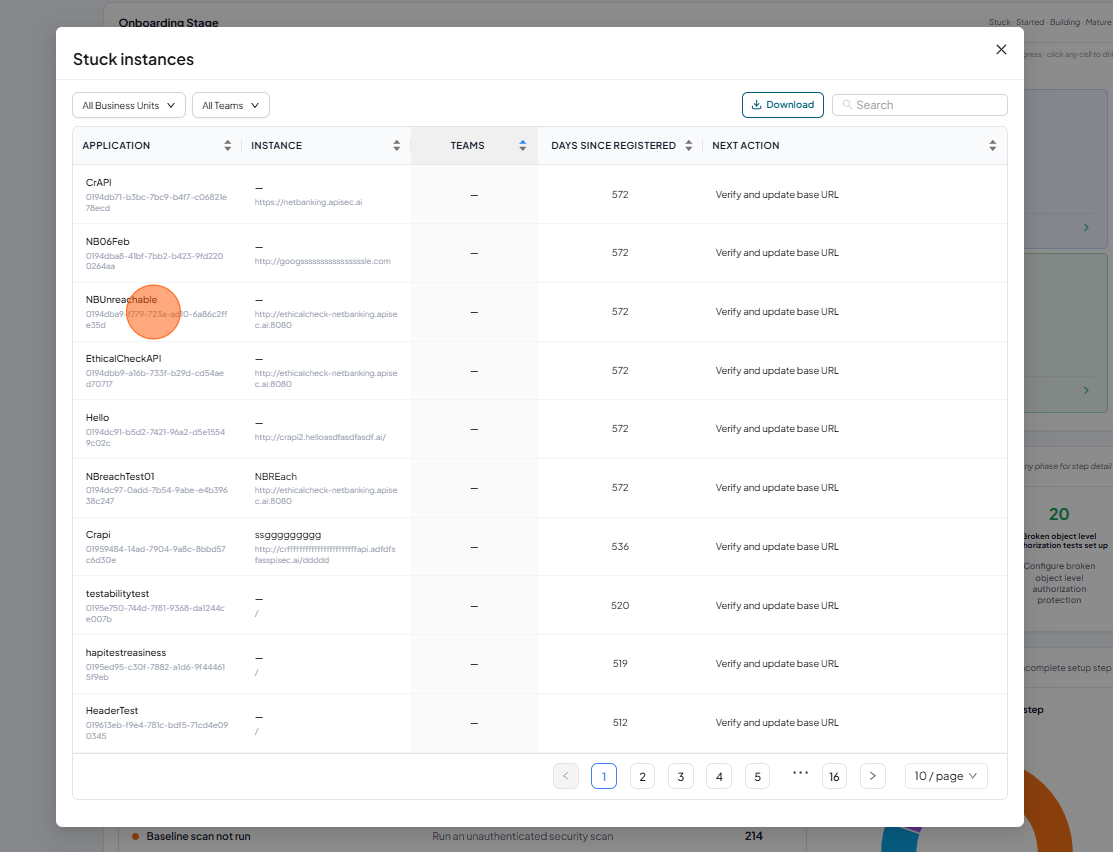
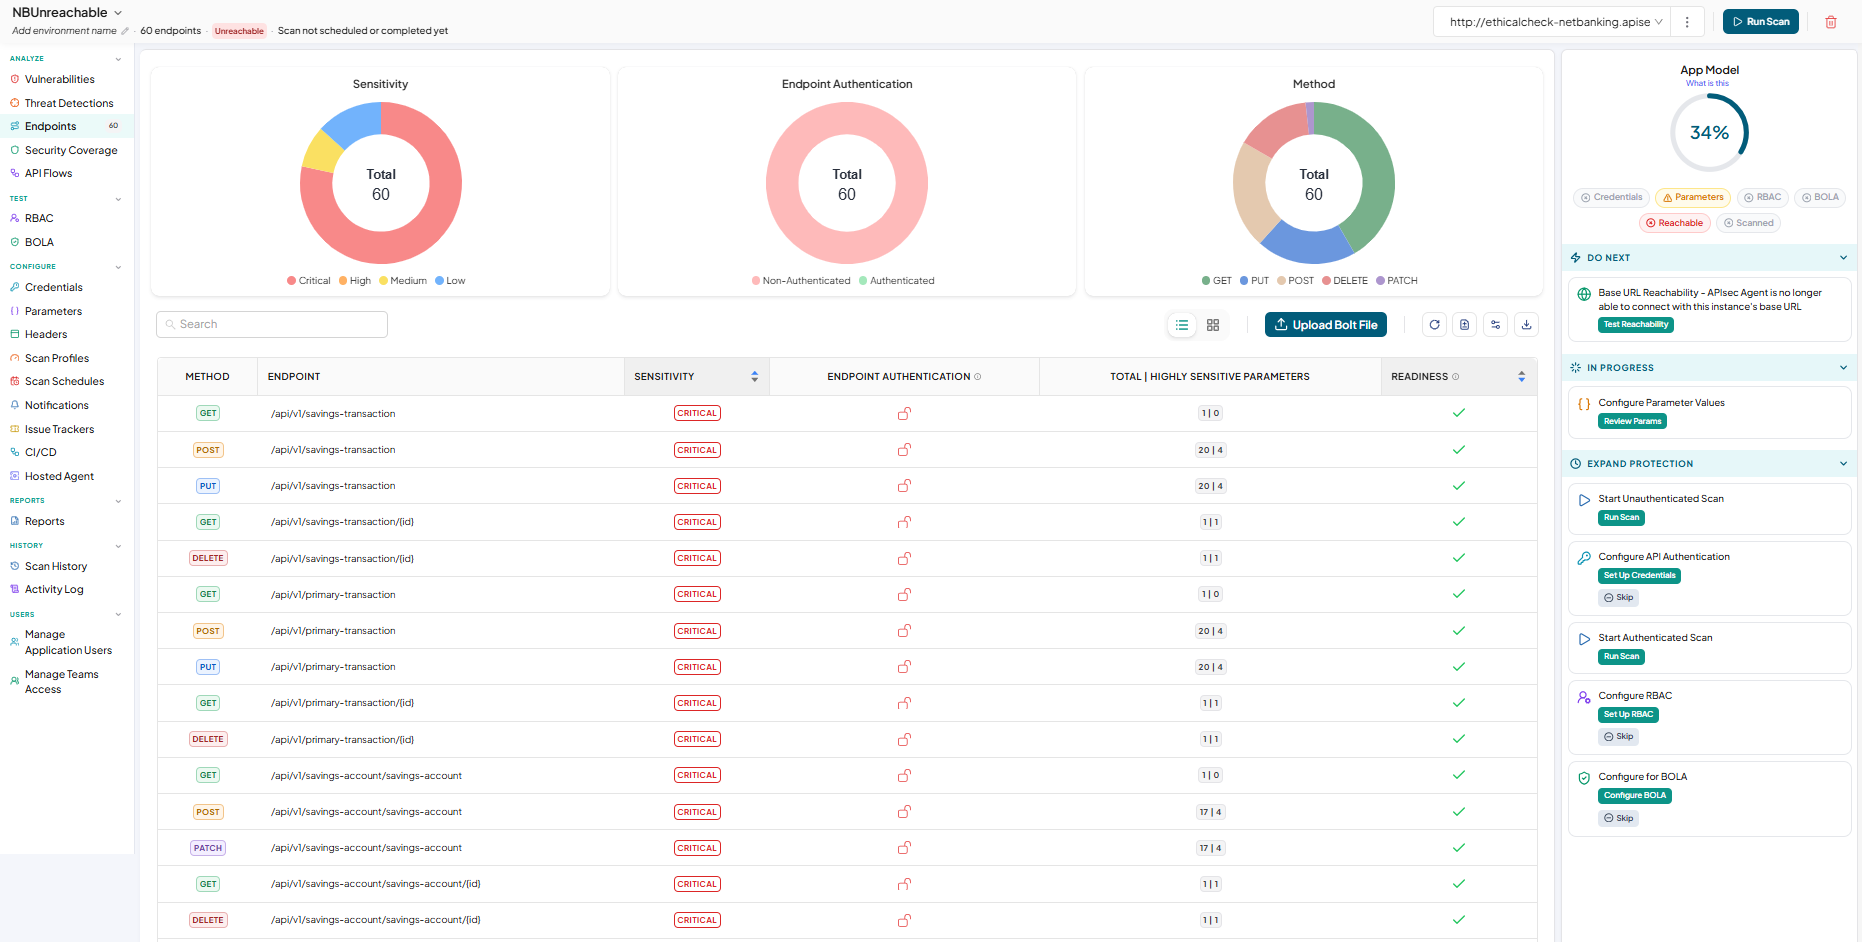
Click on the application to view the details
Setup Pipeline
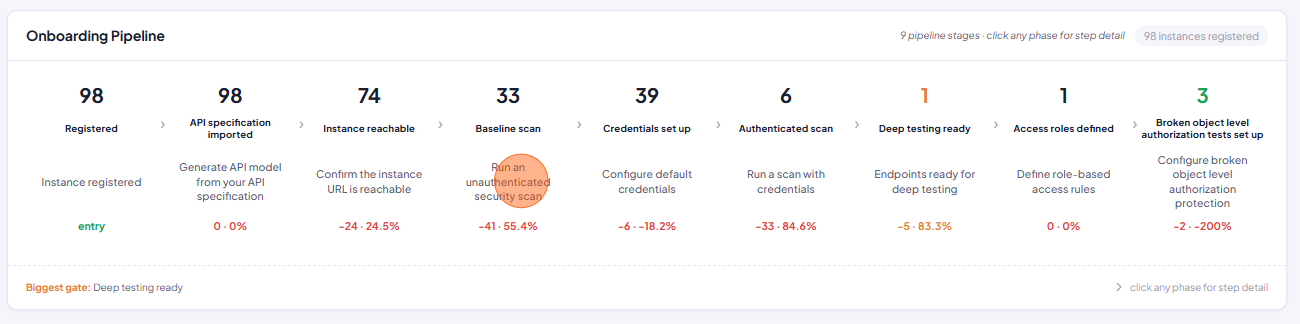
The Setup Pipeline section provides a stage-by-stage view of the onboarding process, showing how application instances progress through each onboarding milestone.
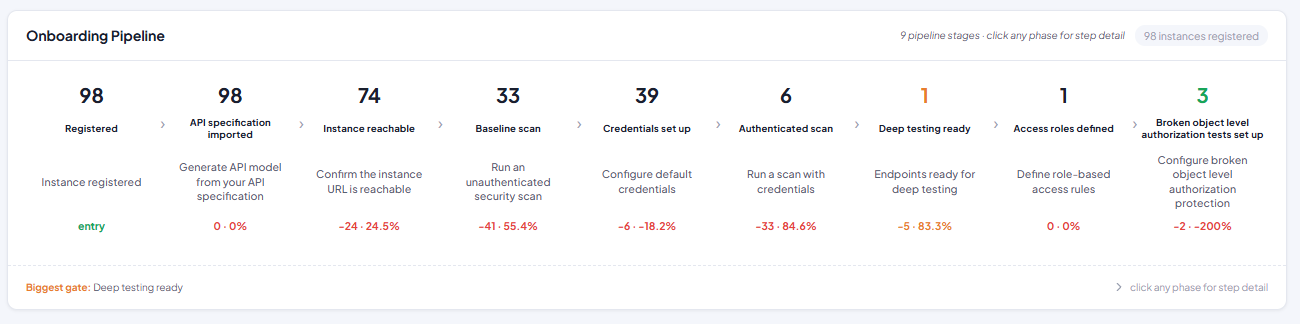
The pipeline displays the number of instances that have successfully completed each stage, allowing you to identify where onboarding progress slows down.
The pipeline includes the following stages:
- Registered: Total number of registered instances.
- API specification imported: Generate API model from your API specification
- Instance Reachable: Confirm the instance URL is reachable.
- Baseline Scan: Run an unauthenticated security scan.
- Credentials Set Up: Configure default credentials.
- Authenticated Scan: Run a scan with credentials.
- Deep Testing Ready: Endpoints ready for deep testing.
- Access Roles Defined: Define role-based access rules.
- Broken object level authorization tests set up: Configure broken object level authorization protection.
Each stage displays the number of instances currently in that phase, along with the percentage of instances that progressed from the previous stage.
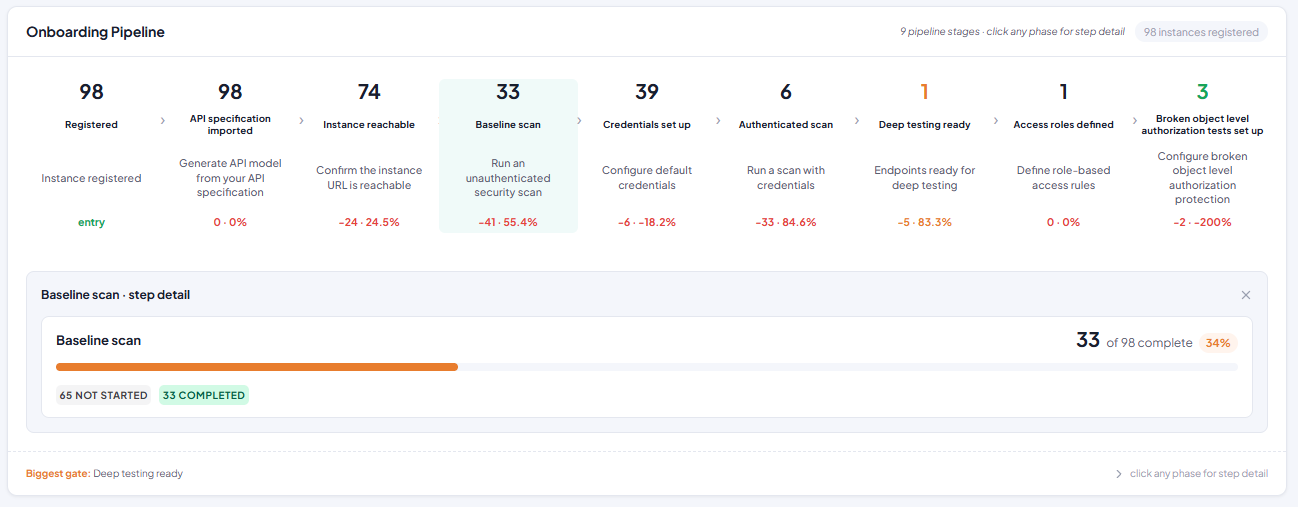
Click a pipeline stage to view the application instances associated with that stage.
Attention by Step
The Attention by Step section helps identify the onboarding steps preventing application instances from progressing further.
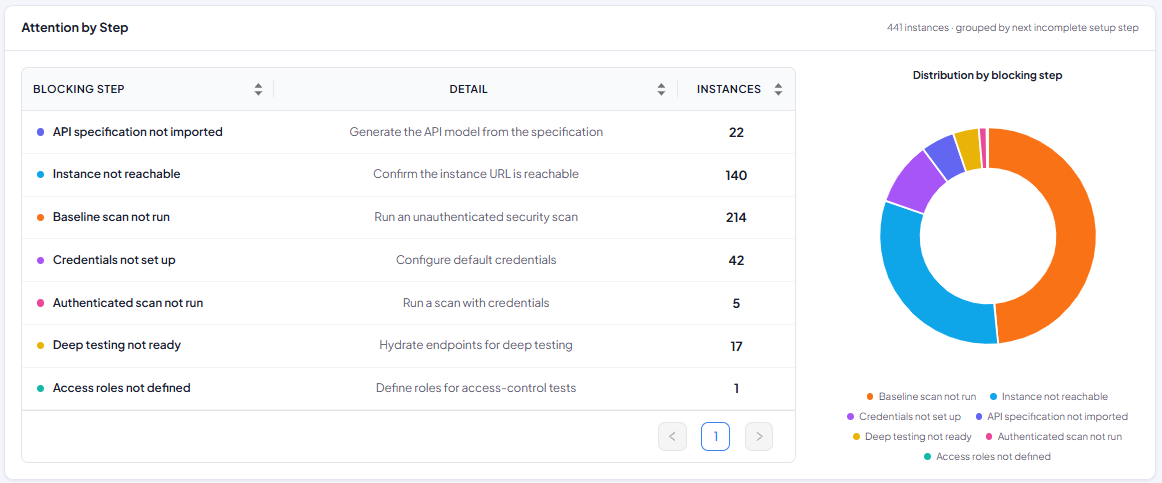
The table lists:
- Blocking Step – The onboarding stage where progress has stopped.
- Detail – A brief description of the required action.
- Instances – The number of application instances blocked at that step.
A donut chart provides a visual distribution of blocked instances across each onboarding stage, making it easy to identify the most common onboarding bottlenecks.
Click any segment of the chart to open a detailed view of the corresponding application instances.
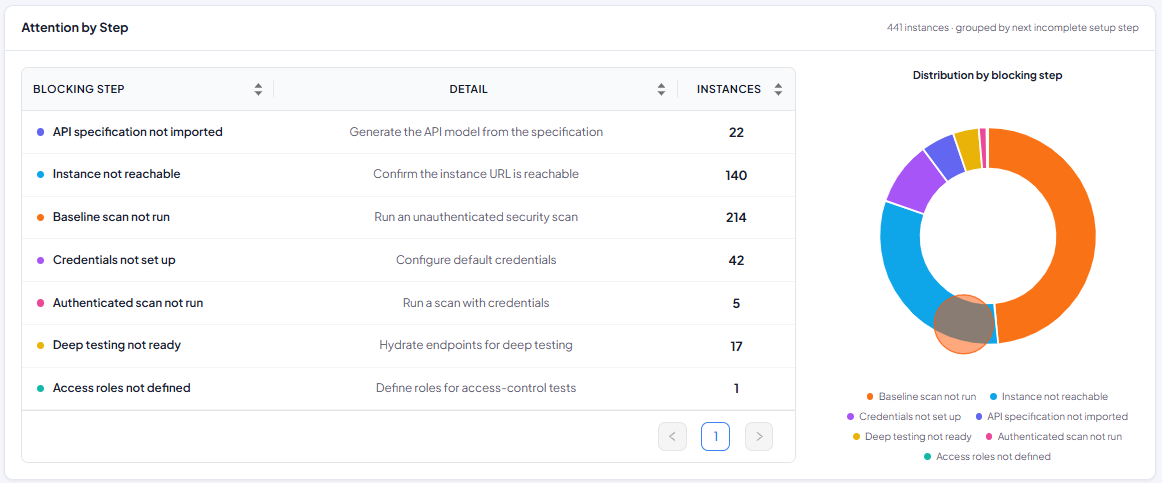
It displays the list of instances currently blocked at the selected stage, along with details such as:
- Application – The application name and application Id.
- Instance – The associated application instance.
- Teams – The team assigned to the application, if applicable.
- Silence Days – The number of days the instance has remained in the current blocking stage.
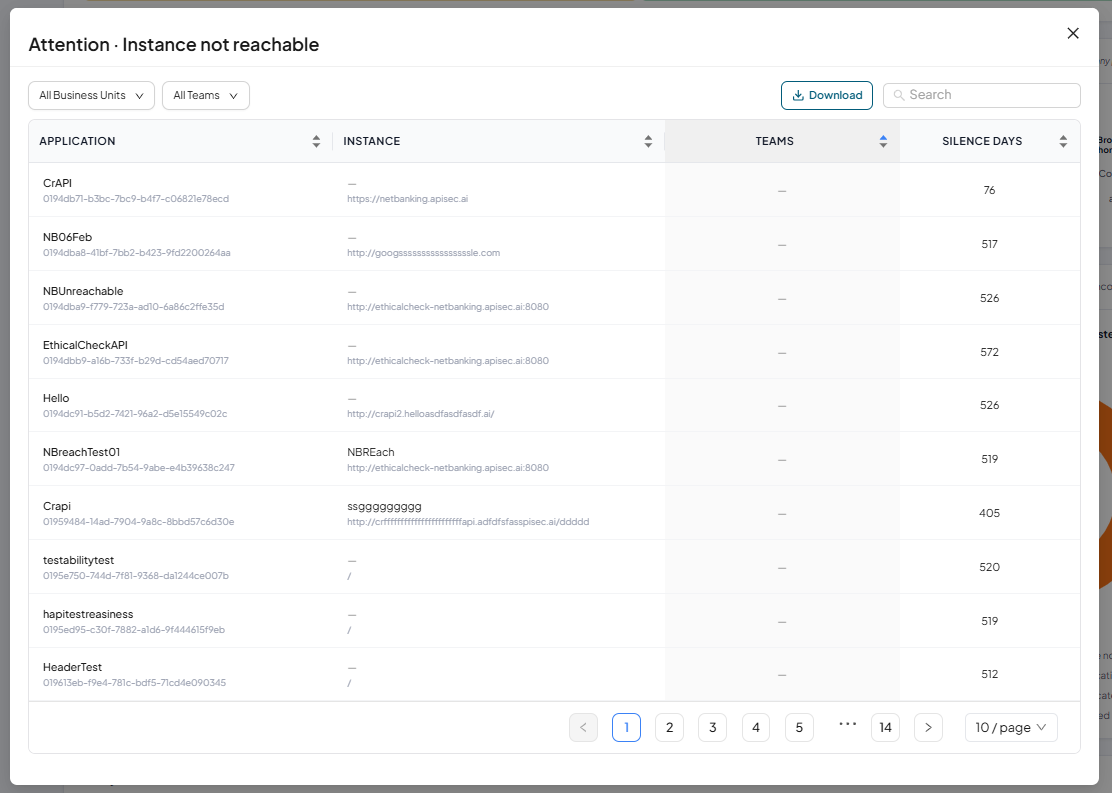
Click Download to export the displayed list of applications as a CSV file.
Use the All Business Units and All Teams filters to display applications that match the selected criteria.
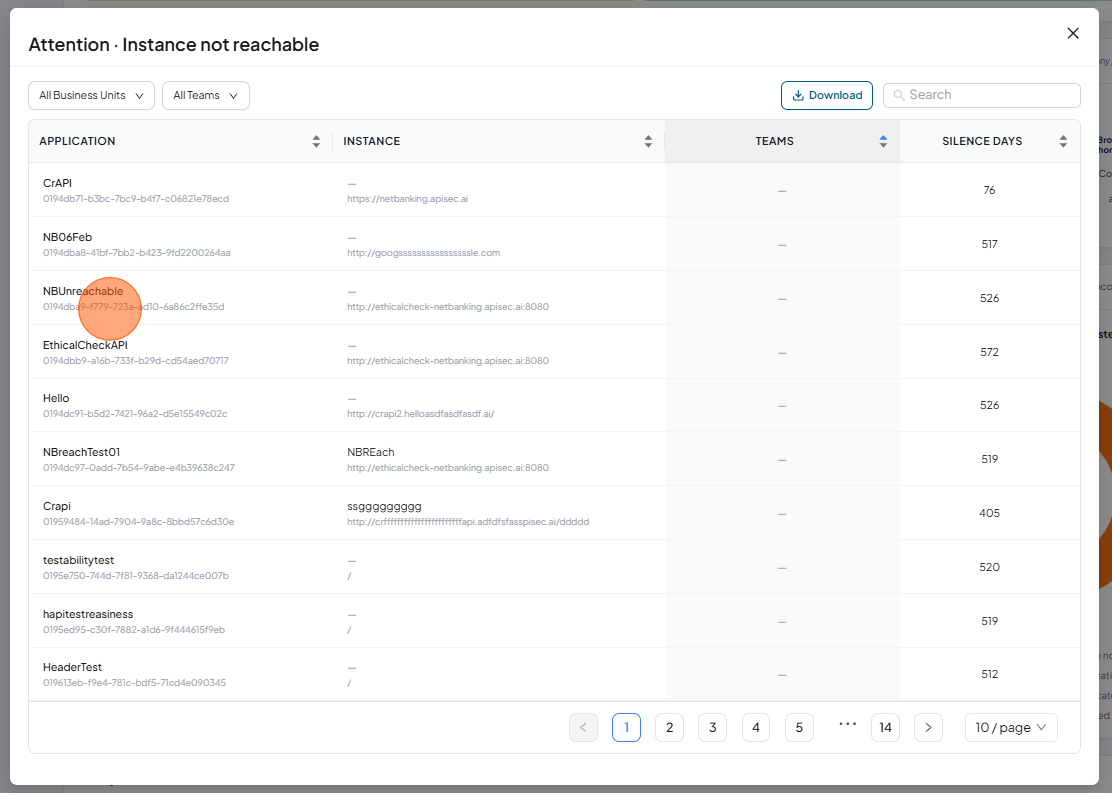
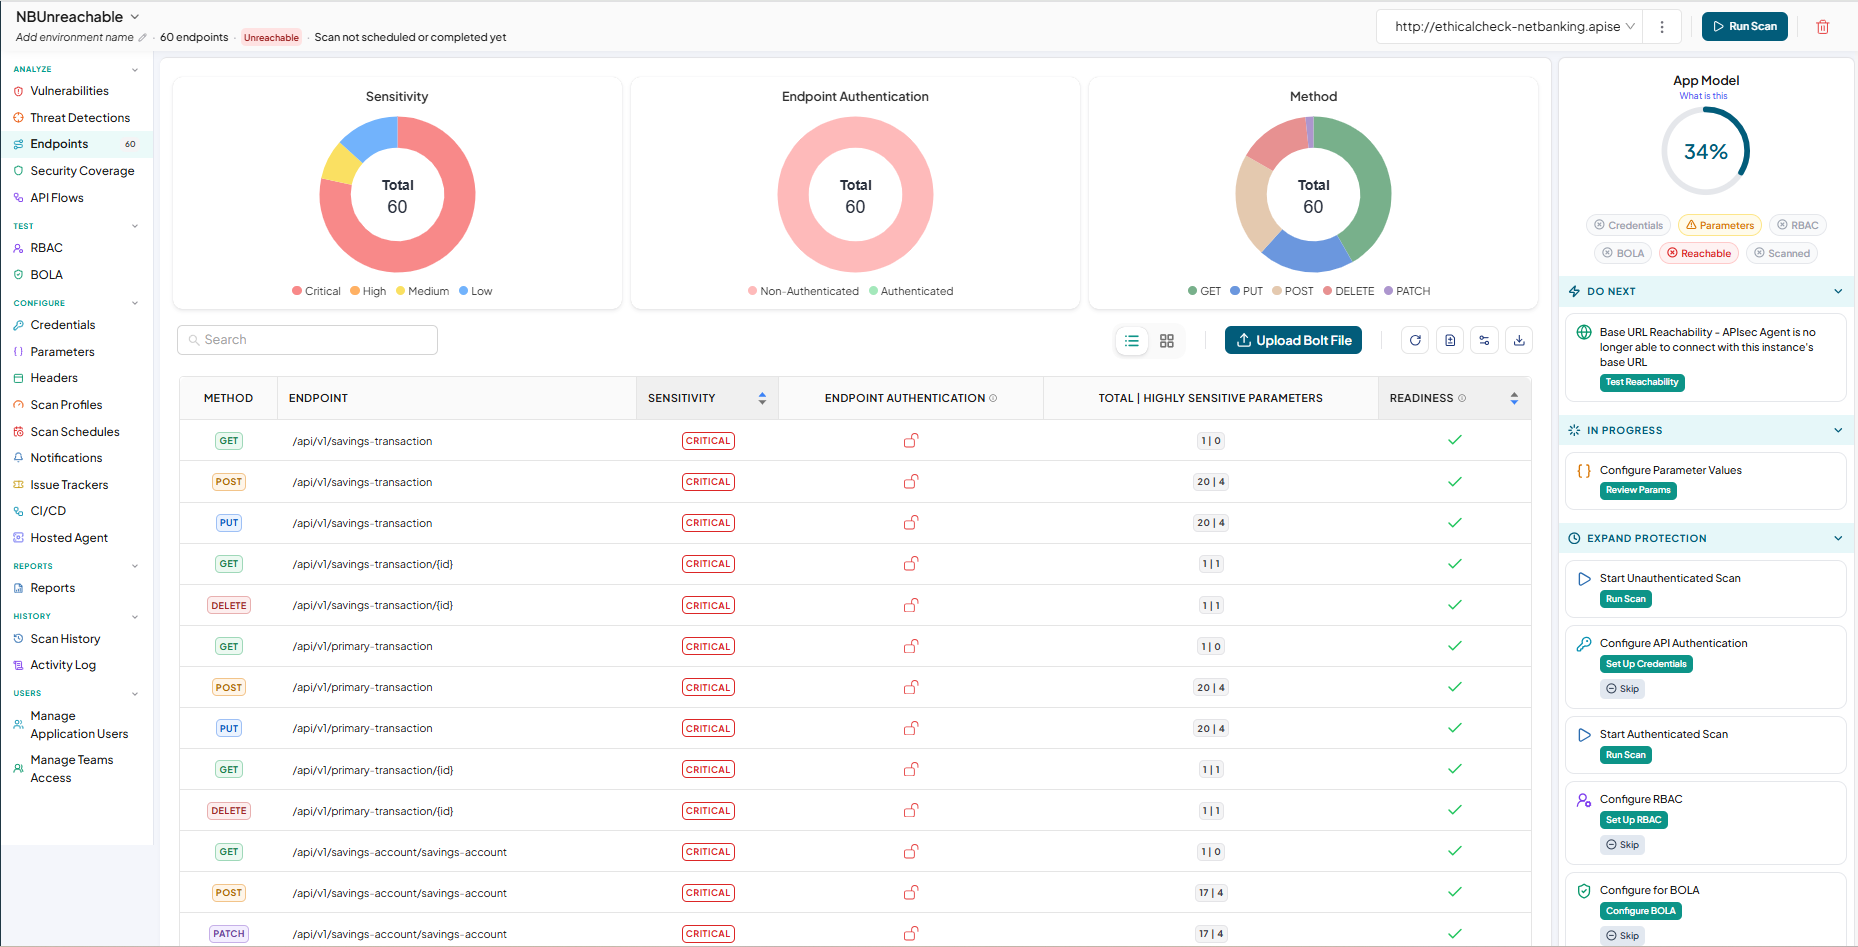
Click an application row to view the details of the selected application.
Security Exposure
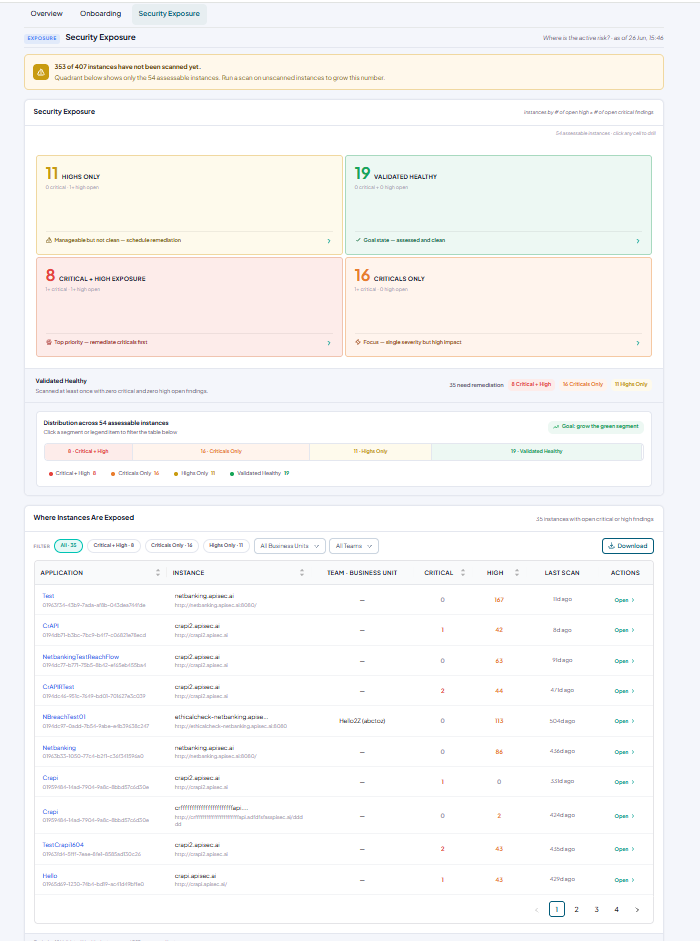
The Security Exposure tab provides a comprehensive view of the security exposure of your application instances. It helps you identify instances with open Critical and High severity vulnerabilities, monitor security health across the tenant, and prioritize remediation efforts.
Security Exposure
The Security Exposure section categorizes assessed application instances based on the number of open Critical and High severity vulnerabilities.
The following categories are displayed:
- Highs Only: Instances with one or more High severity vulnerabilities and no Critical vulnerabilities. These instances should be scheduled for remediation.
- Validated Healthy: Instances with no open Critical or High severity vulnerabilities, representing the desired security state.
- Critical + High Exposure: Instances containing both Critical and High severity vulnerabilities. These instances require immediate remediation.
- Criticals Only: Instances with one or more Critical vulnerabilities and no High severity vulnerabilities. These instances should be prioritized for remediation.
Click any category tile to view the application instances that belong to the selected exposure category.
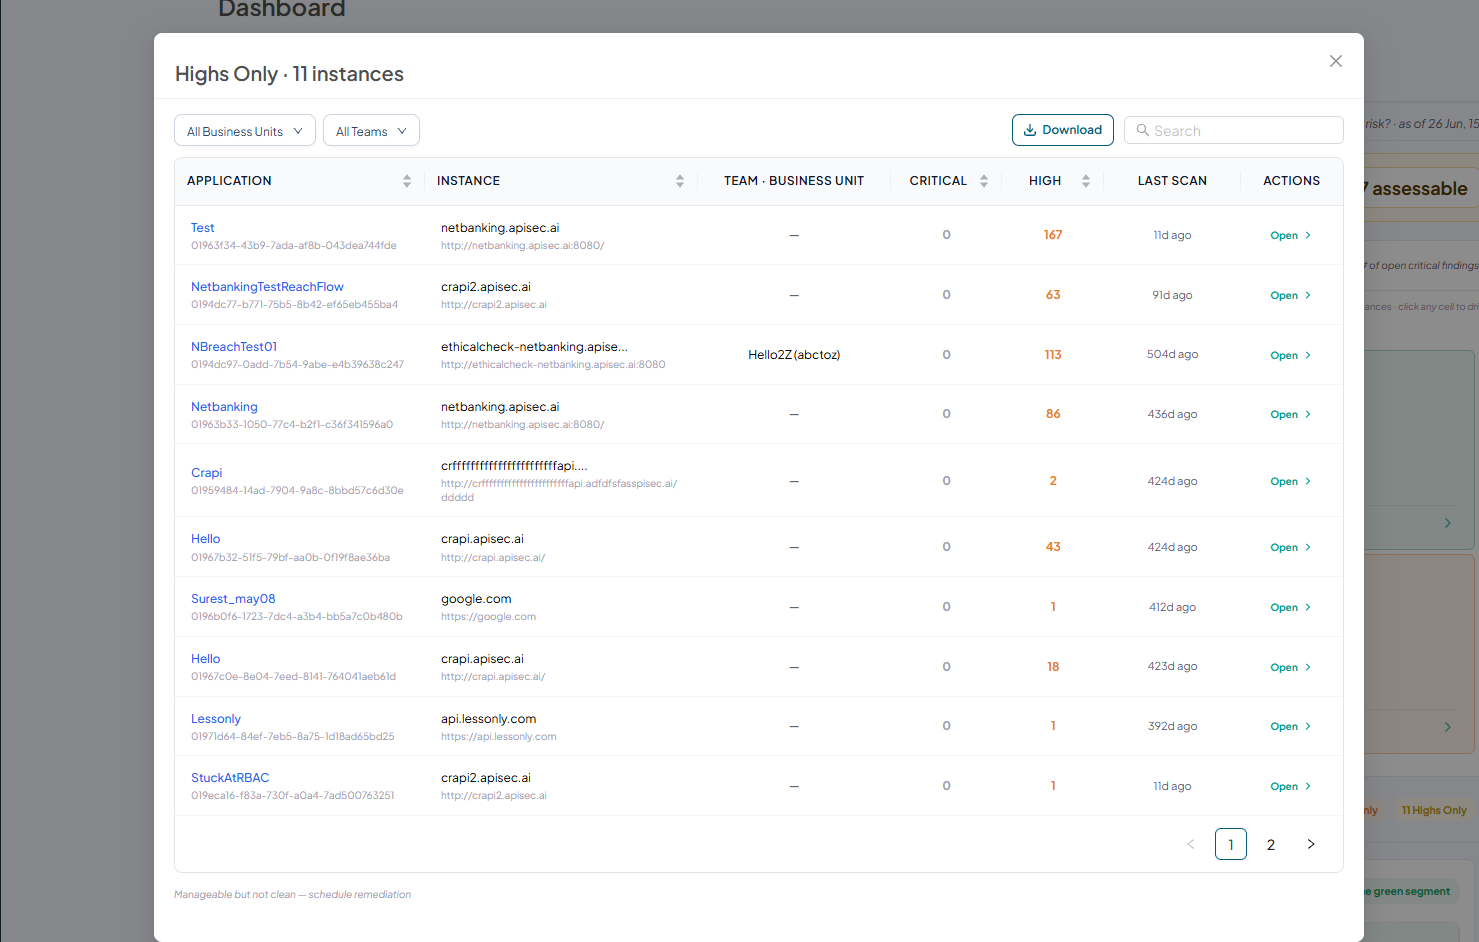
Click Download to export the displayed list of applications as a CSV file.
Use the All Business Units and All Teams filters to display applications that match the selected criteria.
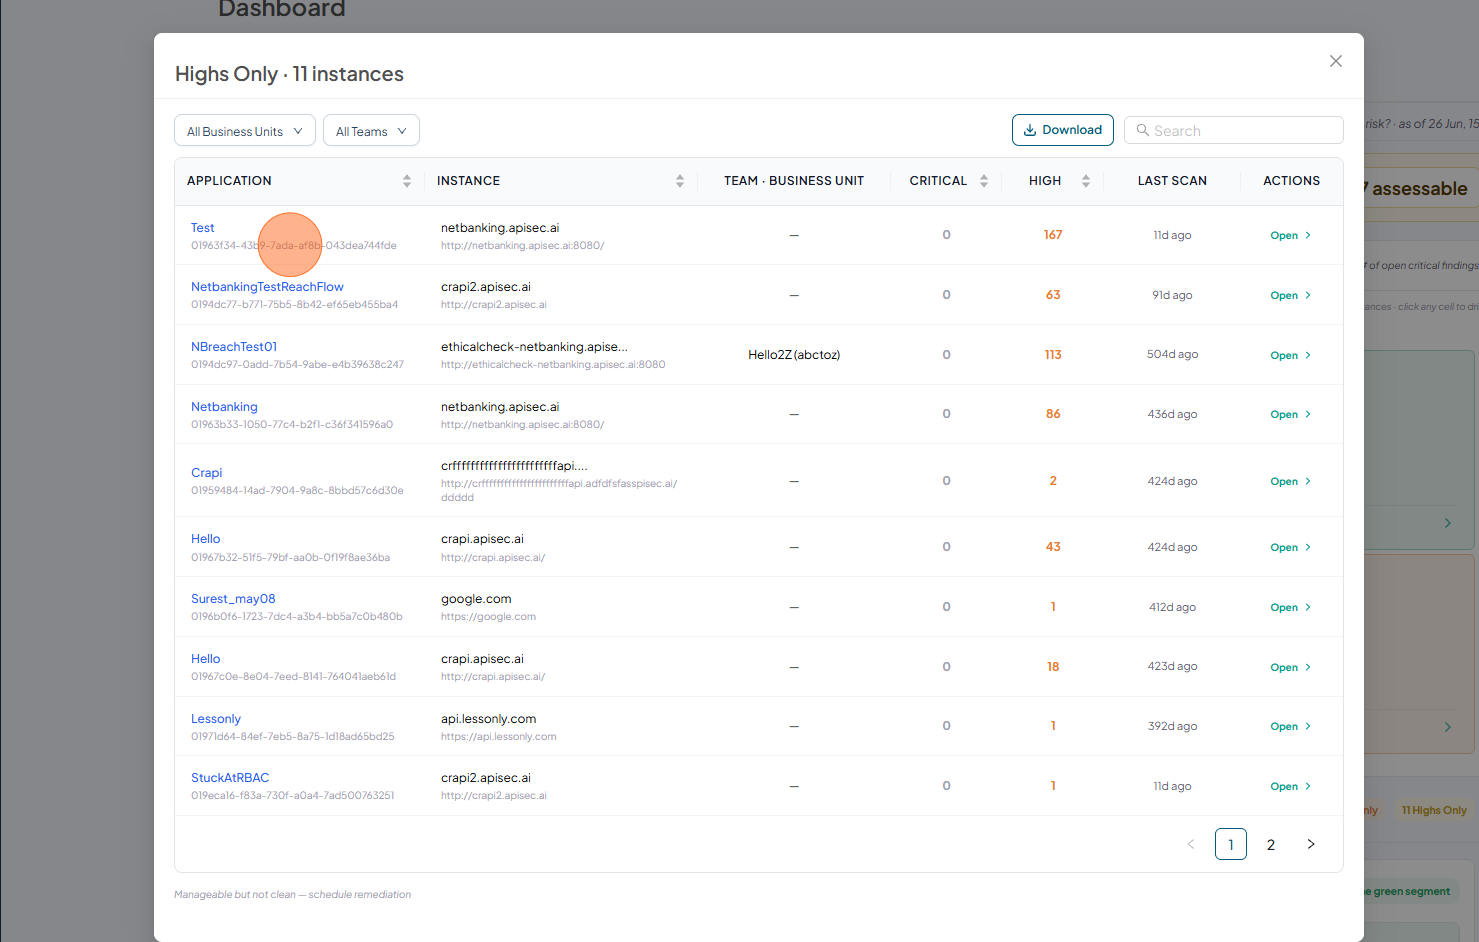
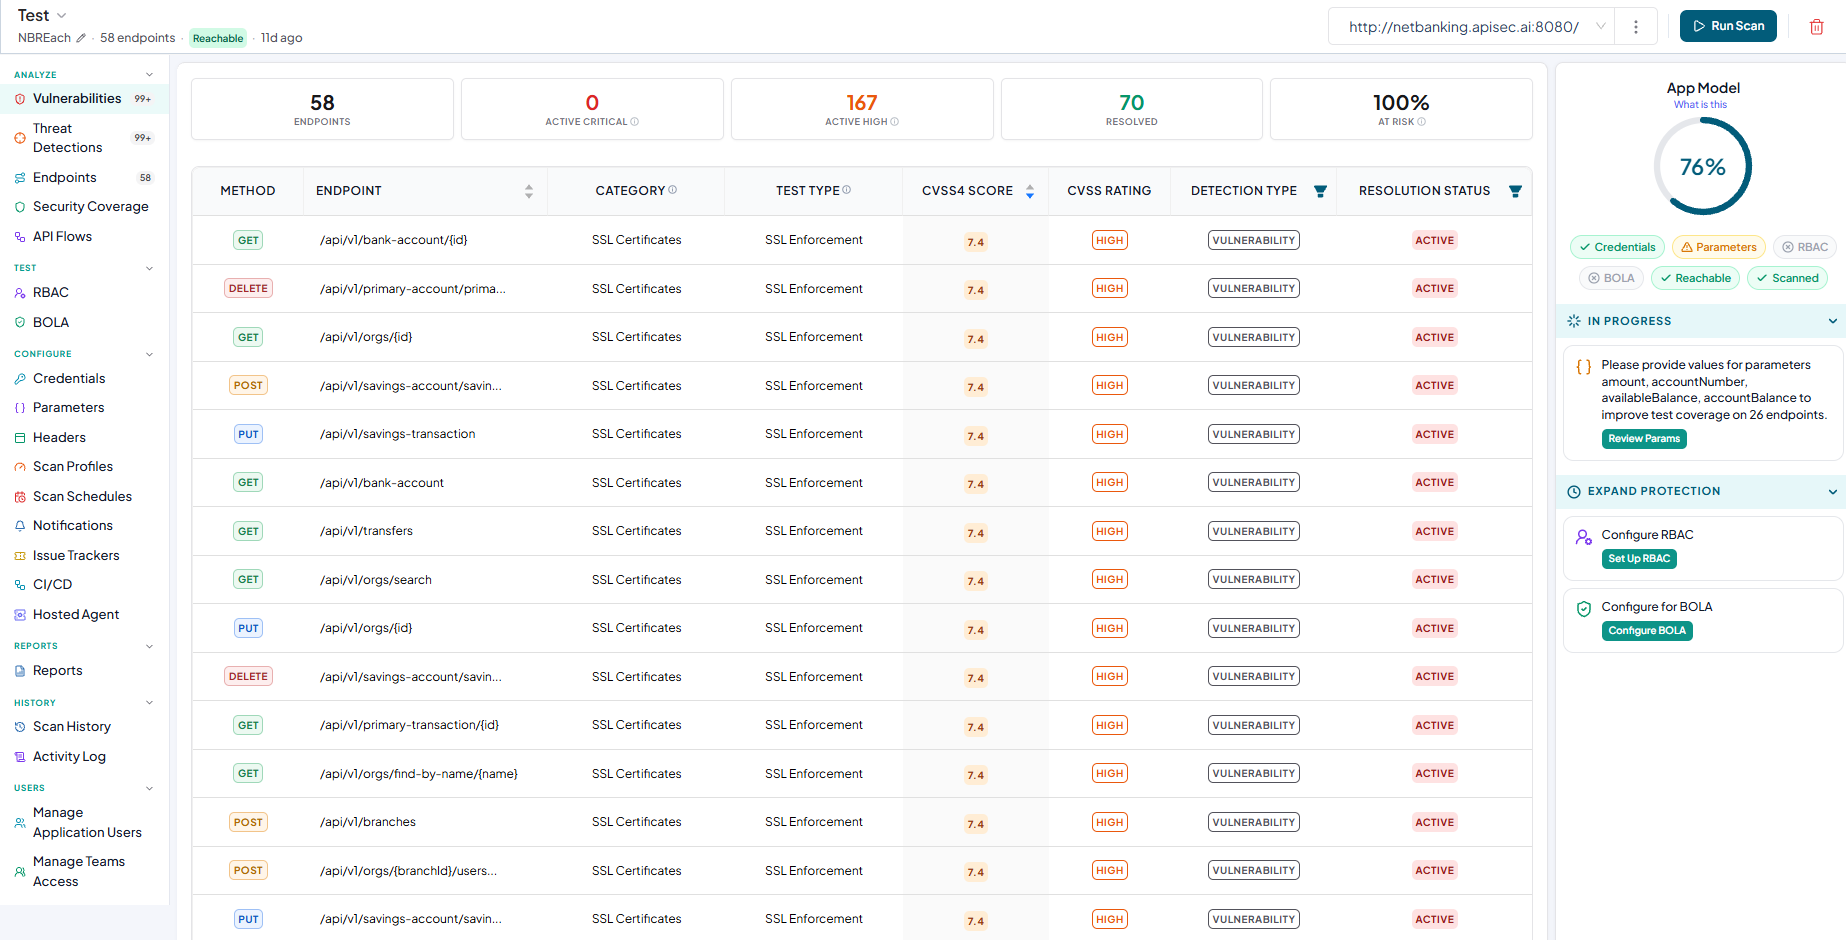
Click an application row to view the details of the selected application.
Validated Healthy
The Validated Healthy section provides a visual distribution of all assessable application instances based on their security exposure.
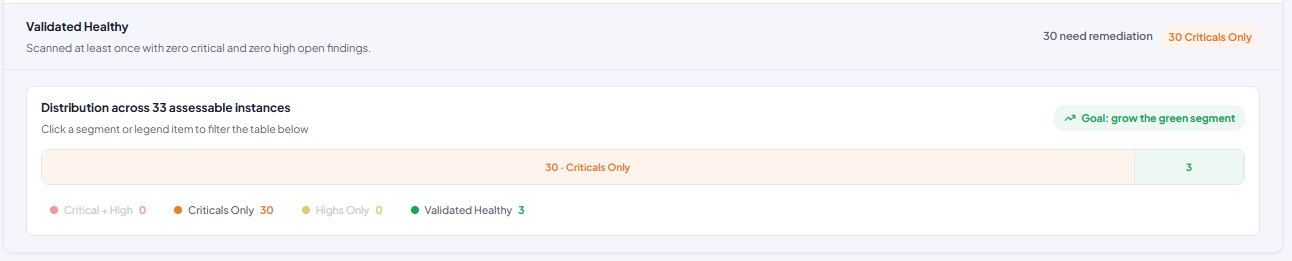
The distribution groups instances into the following exposure categories:
- Critical + High
- Criticals Only
- Highs Only
- Validated Healthy
This visualization helps you quickly understand the overall security exposure of your tenant and the proportion of applications in each exposure category.
Click any segment in the distribution bar to filter the application list below and display only the corresponding instances.
Where Instances Are Exposed
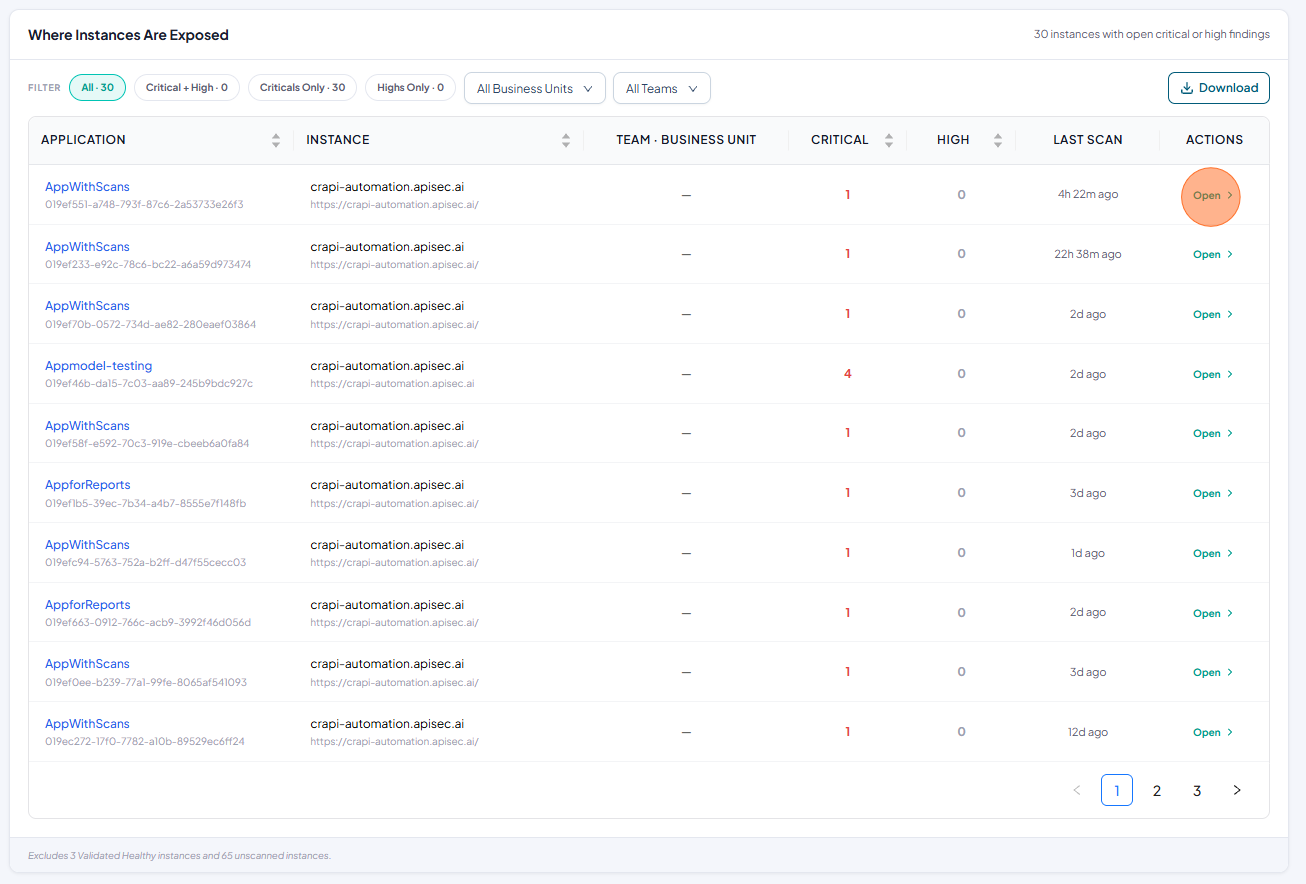
The Where Instances Are Exposed section lists all application instances that contain open Critical or High severity vulnerabilities.
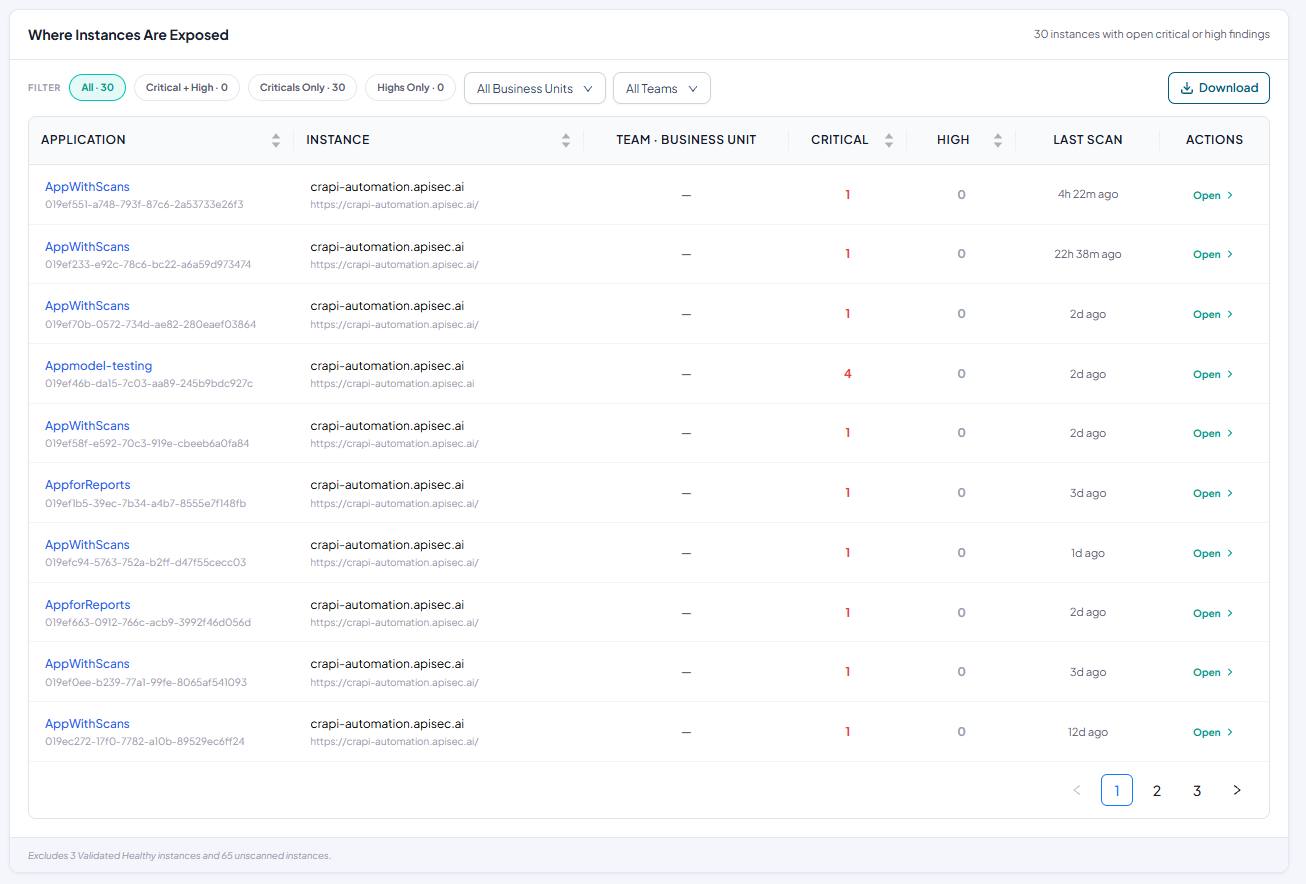
Click Download to export the displayed list of applications as a CSV file.
Use the All Business Units and All Teams filters to display applications that match the selected criteria.
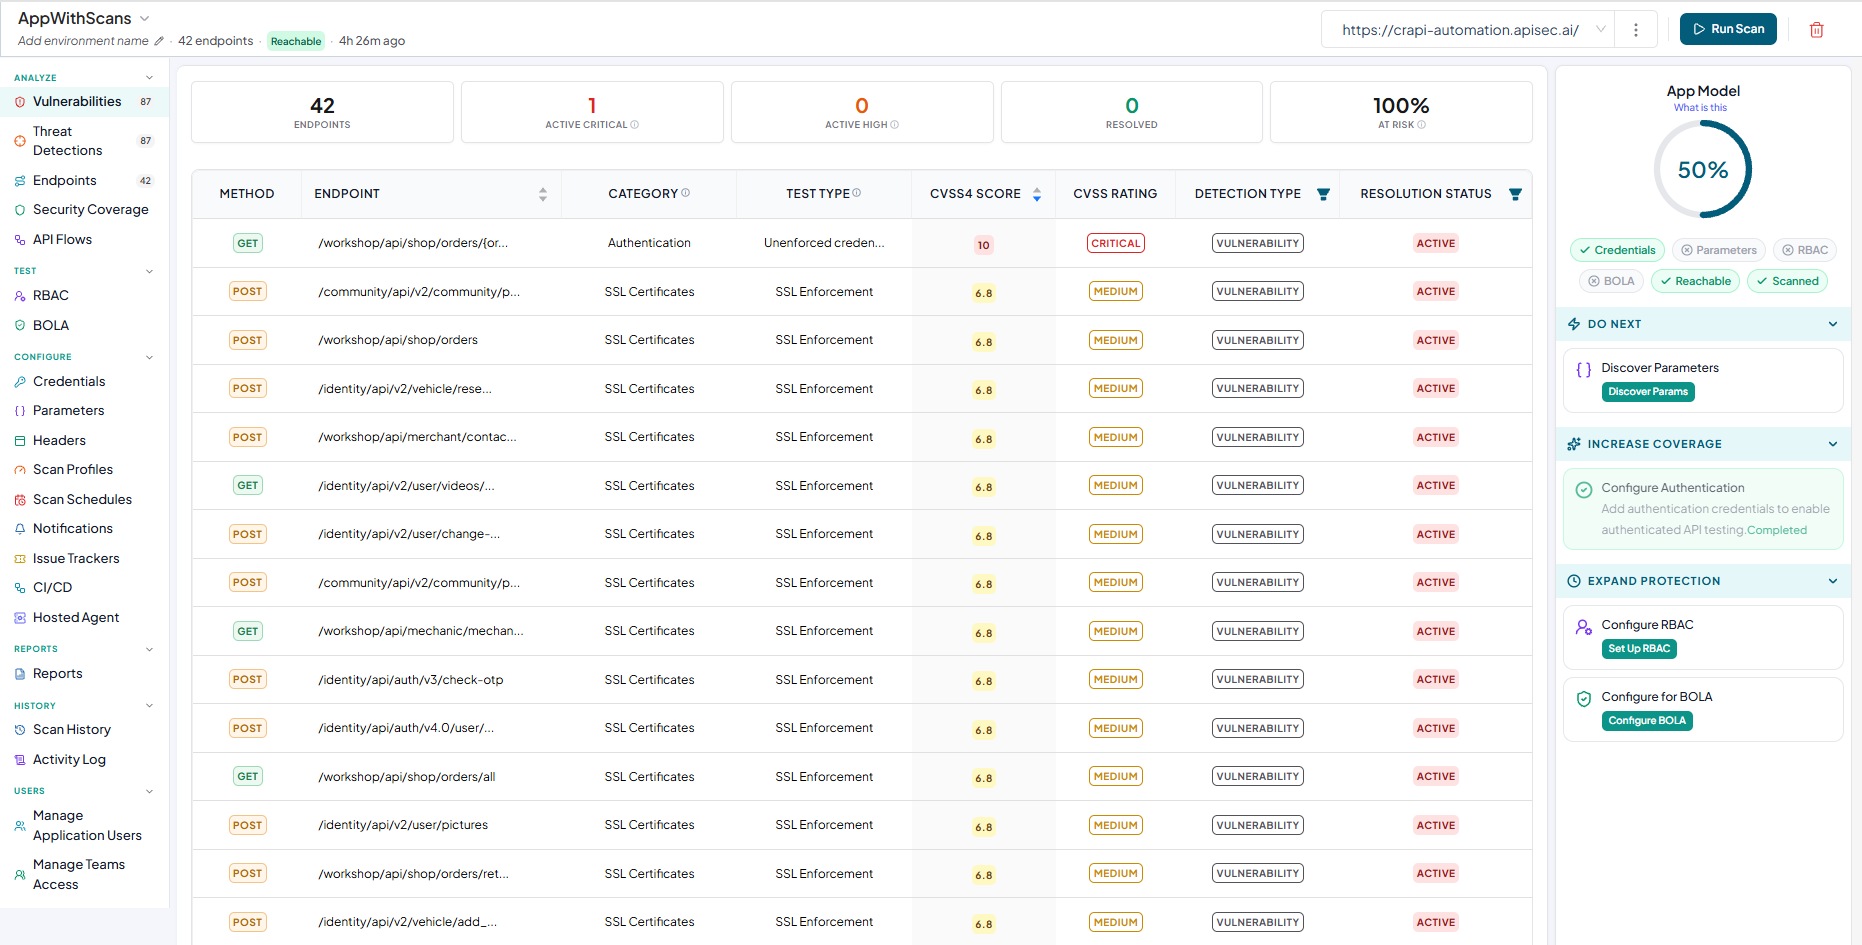
Click Open in the Actions column to navigate to the selected application's detailed security information.